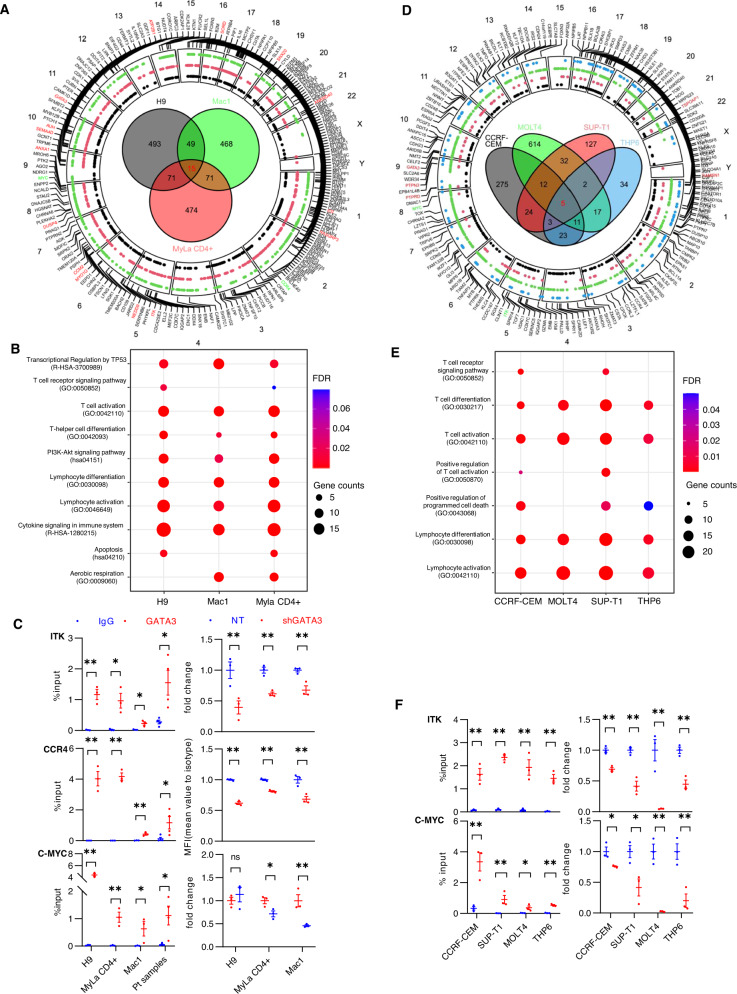
Fig. 2. GATA-3 target genes identified in CTCL and T-ALL regulate cell growth and viability.
A Circus plot showing GATA-3 target genes and chromosome location in CTCL cell lines. Target gene names identified in Mac1 (green), MyLa CD4 + (red), H9 (black), respectively, are indicated with the dots shown. Venn diagram of GATA-3 target genes in each cell line is shown, and target genes shared across all three cell lines are shown in red. Target genes used for validation are also shown in green. B Dot plots of representative pathways enriched with GATA-3 target genes in CTCL are indicated. C GATA-3 ChIP and binding enrichment at selected GATA-3 target genes (ITK, CCR4, and c-MYC) is shown (at left) for the 3 CTCL cell lines indicated, and for malignant T cells obtained from Sezary syndrome patients (n = 4). Gene expression upon GATA-3 knockdown (at right) was determined by qRT-PCR for ITK (top) and C-MYC (bottom). CCR4 expression was determined by flow cytometry and ∆MFI reported. Percent input (%input) was used as Y-axis in binding enrichment. Fold change was normalized to total GAPDH levels. D Circus plot showing GATA-3 target genes and chromosome location in T-ALL cell lines. Target gene names identified in THP6 (blue), SUPT1 (red), MOLT4 (green) CRF-CEM (black), respectively, are indicated with the dots shown. Venn diagram of GATA-3 target genes in each cell line is shown, and target genes shared across all four cell lines are show in red. Target genes used for validation are also shown in green. E Dot plots of representative pathways enriched with GATA-3 target genes in T-ALL are indicated. F GATA-3 ChIP and binding enrichment at selected GATA-3 target genes (ITK and c-MYC) is shown (at left) for the 4 T-ALL cell lines indicated. Gene expression upon GATA-3 knockdown (at right) was determined by qRT-PCR for ITK (top) and C-MYC (bottom). Percent input (%input) was used as Y-axis in binding enrichment. Fold change was normalized to total GAPDH levels. Data are represented as mean ± s.e.m (standard error of the mean). *p < 0.05, **p < 0.01.

