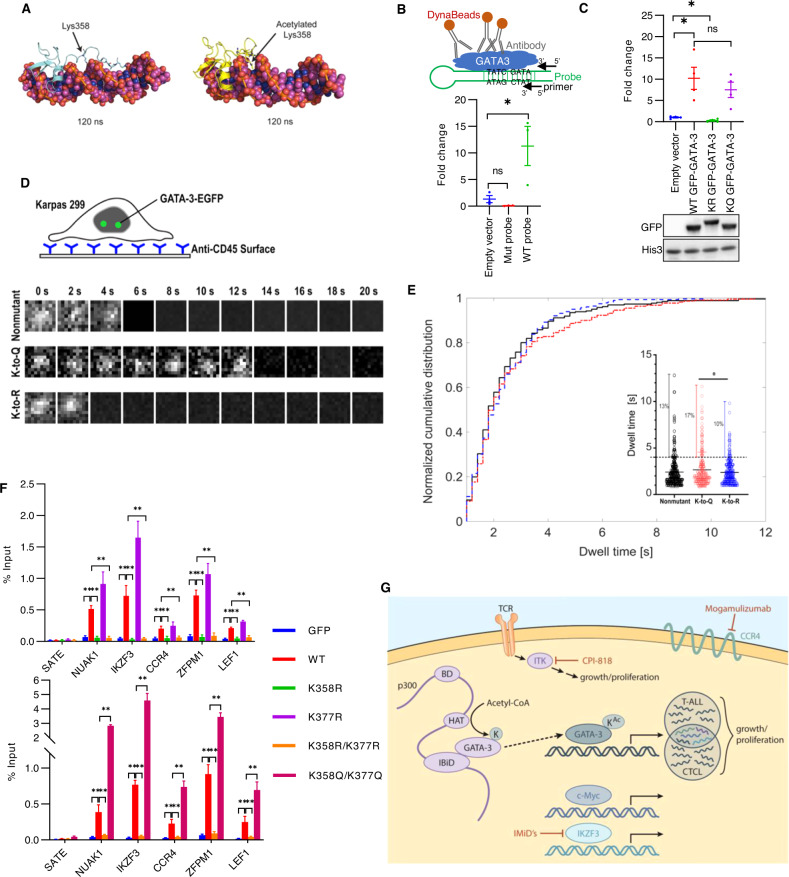
Fig. 6. GATA-3 acetylation is required for DNA binding.
A Molecular dynamics simulations are performed comparing GATA-3 that is unacetylated at K358 (left) or acetylated at K358 (right). B Schematic of the in silico GATA-3 DNA-binding assay is shown. GFP antibody recognizes GATA-3-DNA probe complex, which is immunoprecipitated using DynaBeads. Primers specific for the DNA probe are used to quantify the immunoprecipitated DNA probe in complex with GATA-3. GFP-tagged GATA-3 specifically binds to DNA probes containing a palindromic consensus GATA binding motif (WT probe), but not a DNA probe in which the GATA binding motif has been mutated (Mut probe). C Quantification of GATA DNA probe (WT probe) binding to wild type- (WT), K358R/K377R mutated- (KR), and K358Q/K377Q- mutated (KQ) GATA-3 expressed in HEK293T cells. A representative immunoblot from 4 independent experiments is shown. D Schematic of the immobilization of Karpas299 using anti-CD45 antibodies on a glass coverglass for stable single-molecule imaging. Representative time-lapsed single-molecule images of GFP-tagged WT, gain-of-function (GOF, K358Q/K377Q), and loss-of-function (LOF, K358R/K377R) GATA-3 are shown. E Distribution of GATA-3 dwell times (>1 s) measured by single-molecule microscopy in the wild type (black), GOF (K-to-Q, shown in red), and LOF mutant (K-to-R, shown in blue) Karpas299 cells. The insert shows the distribution of individual GATA-3 dwell times (s) for each cell line. Dashed line separates GATA-3 binding events that are at least 4 s long from shorter events. Fraction of events longer than 4 s: 13% for the wild type, 17% for the K-to-Q mutant, and 10% for the K-to-R mutant. F Analysis of GATA-3 binding to representative target genes in Karpas299 cells overpressing GFP alone, GFP-tagged WT-, K358R-, K377R-, K358R/K377R-, and K358Q/K377Q GATA-3 by GATA-3 ChIP-qPCR. G Model of GATA-3 acetylation and transcriptional regulation of therapeutically relevant target genes. Data are mean ± s.e.m. (standard error of the mean). ns not significant. *p < 0.05, **p < 0.01.

