Fig. 6.

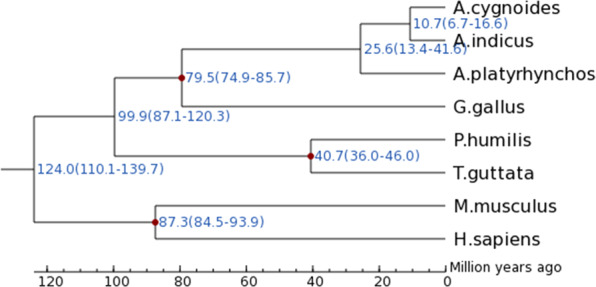
Phylogenetic tree reconstructed using all single-copy orthologs. The scale at the bottom of the figure represents the divergence time. The red dots represent the divergence time and its range (in brackets) between two branches.

Phylogenetic tree reconstructed using all single-copy orthologs. The scale at the bottom of the figure represents the divergence time. The red dots represent the divergence time and its range (in brackets) between two branches.