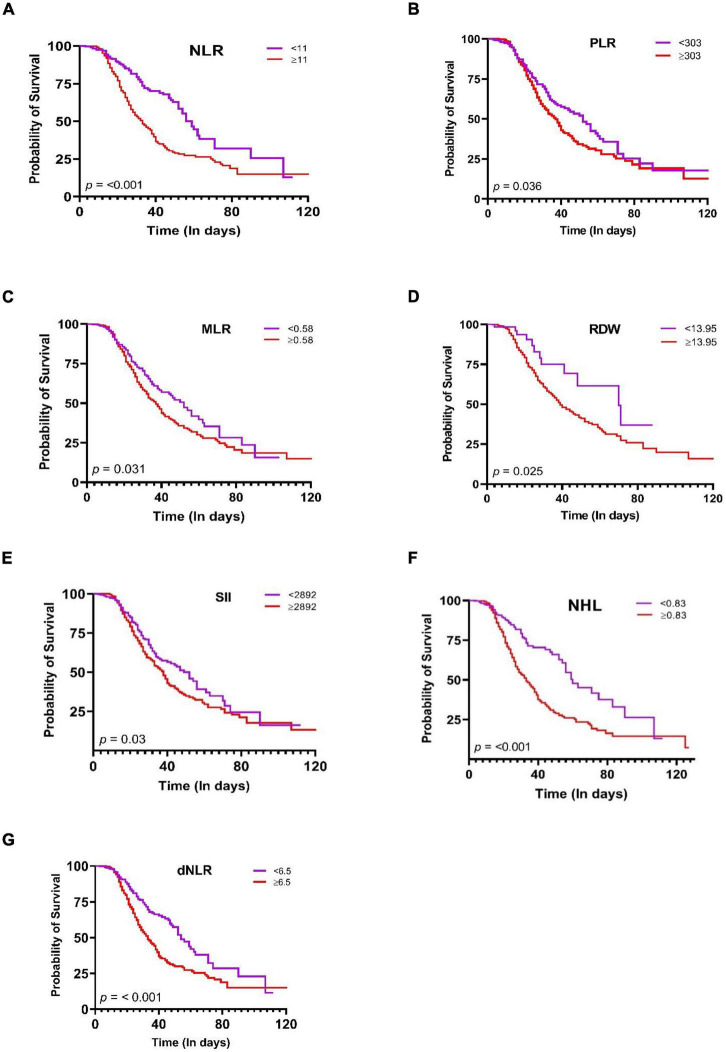
FIGURE 3.
Kaplan–Meier survival curves during hospitalization of COVID-19 in Mexican patients with different cut-off values of the systemic inflammation indices. (A) NLR, (B) PLR, (C) MLR, (D) RDW, (E) SII, (F) NHL, (G) dNLR. Statistical analyses were performed by Kaplan-Meier method and compared using the Log-rank test. Significance was set at p-value < 0.05.

