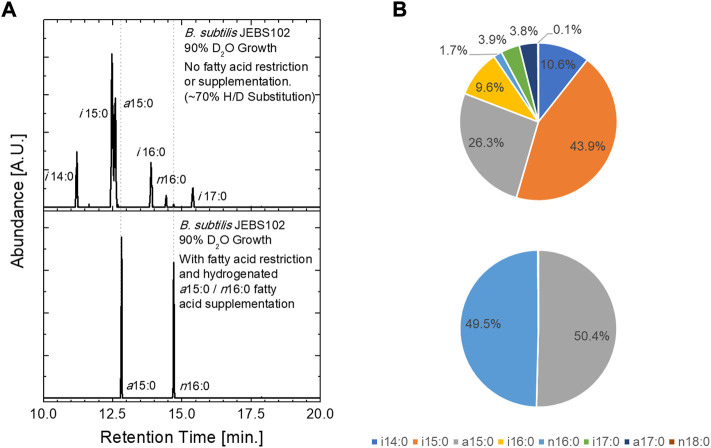
FIGURE 2.
Fatty acid uptake was assessed using GC/MS analysis of extracted FAs from B. subtilis JEBS102 cells grown in 90% D2O growth conditions, with or without FA restriction and supplementation using the procedures described. (A) Chromatograms illustrate the presence of the seven native FAs in the upper panel and only the two supplemented FAs in the lower panel. Deuterium inclusion in synthesized FAs is indicated by both the decreased elution time and the broadening of the FAME peaks. The trace amounts of n18:0 and n16:0 are contaminants from release agents on plastic labware. (B) Pie charts summarize the FA uptake described in (A). Notable differences in FA uptake between the current construct and prior work can be seen, namely a different ratio of i15:0 to a15:0 in the ‘native’ mixture of FAs in the uninduced cells and a far greater ratio of n16:0 to a15:0 in the induced and FA rescued cells.

