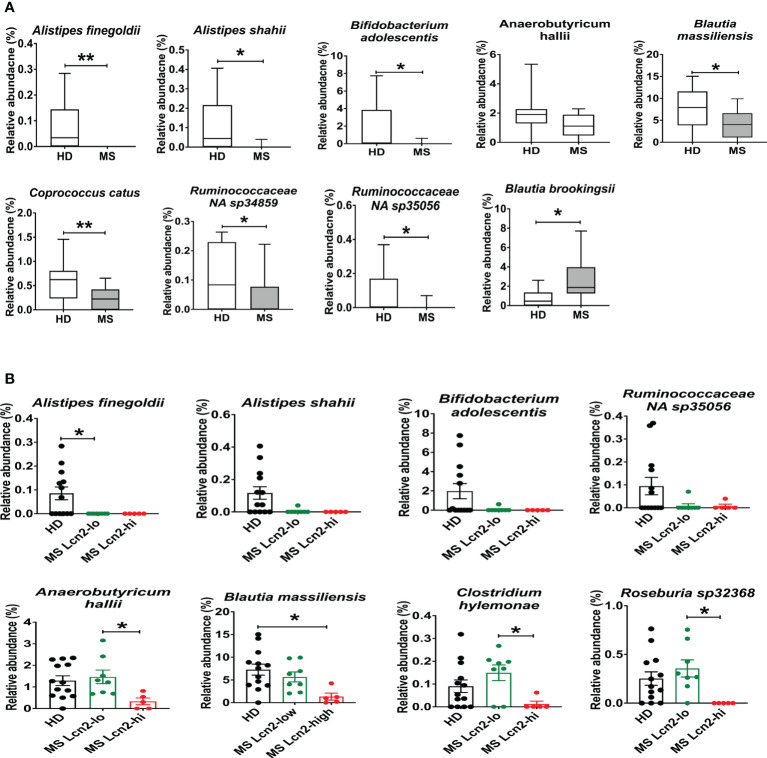
Figure 6.
Enteric microbial composition in HDs and RRMS patients. (A) Enteric microbial composition in HDs and RRMS groups. The list of species exhibits changes in relative abundance of each bacterial taxa between RRMS (n=13) and HDs (n=13) groups. (B) Enteric microbial composition in HDs, MS Lcn-2-low and MS Lcn-2-high groups. The list of species exhibits changes in relative abundance of each bacterial taxa between HDs (n=13), MS Lcn-2-low (n=8) and MS Lcn-2-high (n=5) groups. Mean ± SEM. *P < 0.05, **P < 0.01.

