Figure 4.
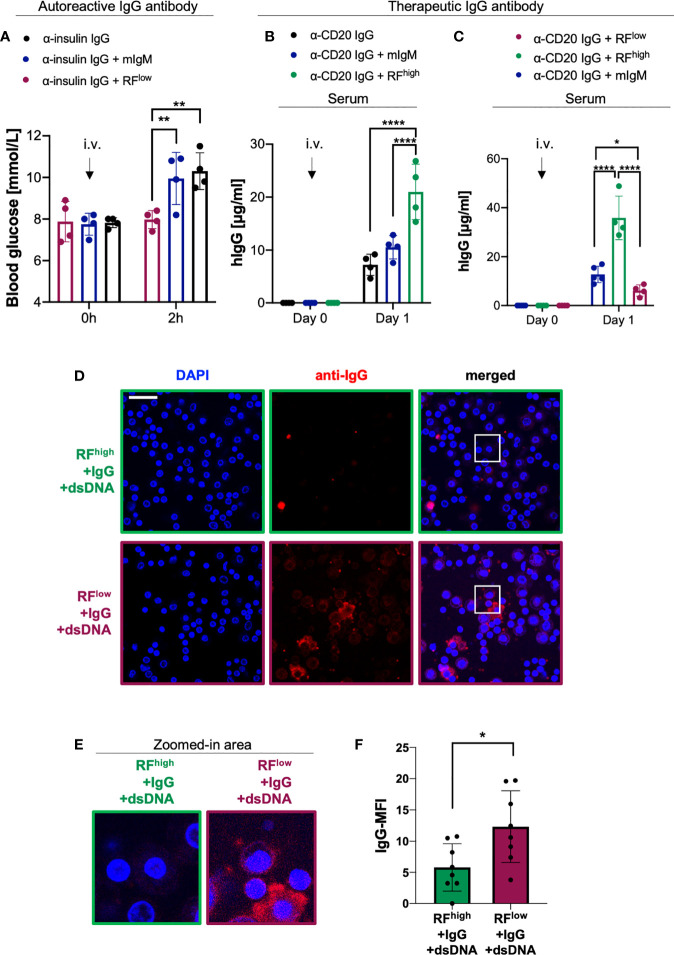
RFlow controls IgG in vivo function by enhancing its degradation. (A) Blood glucose concentrations of WT mice intravenously (i.v.) injected with 100 µg α-insulin IgG alone (black bar, n = 4) or in combination with 20 µg RFlow (purple bar, n = 4) or mIgM control (blue bar, n = 4) measured at indicated time points. Mean ± SD, statistical significance was calculated using two-way ANOVA with Tukey’s multiple comparisons test. **p < 0,01. (B) Serum human IgG concentrations of WT mice at day 0 and day 1 after a single i.v. injection of 20 µg of α-CD20 human IgG (rituximab) alone (black lined bar, n = 4) or in combination with RFhigh (green lined bar, n=4) or mIgM control (blue lined bar, n = 4) as measured by ELISA. Mean ± SD, statistical significance was calculated using two-way ANOVA with Tukey’s multiple comparisons test. ****p<0,0001. (C) Serum human IgG concentrations of WT mice at day 0 and day 1 after a single i.v. injection of 20 µg α-CD20 human IgG (rituximab) in combination with RFhigh (green line, n = 4), with RFlow (purple line, n = 4) or mIgM control (blue line, n = 5) as measured by ELISA. Mean ± SD, statistical significance was calculated using two-way ANOVA with Tukey’s multiple comparisons test. *p < 0,05; ****p < 0,0001. (D) Macrophage phagocytosis assays depicting the levels of macrophage immune complexes uptake. Macrophages were probed with complexes composed of RFhigh+IgG+dsDNA (top, green squared) or with complexes consisting of RFlow+IgG+dsDNA (bottom, purple squared). Scale bar 29 µm. Images are representative of three independent experiments. (E) 4X Zoom-in of the white-squared areas in Figure 4D as indicated above each image. (F) Quantification of mean fluorescent intensity (MFI) of IgG phagocytosed by macrophages detected using anti-IgG antibody: RFhigh+IgG+dsDNA (green bar), RFlow+IgG+dsDNA (purple bar). Data were normalized to IgG-MFI of macrophages probed with immune complexes composed of IgG and dsDNA (shown in Supplementary Figure 4 ). Dots represent single cells (n = 8). Mean ± SD, statistical significance was calculated using unpaired t test with Welch’s correction. *p < 0,05.

