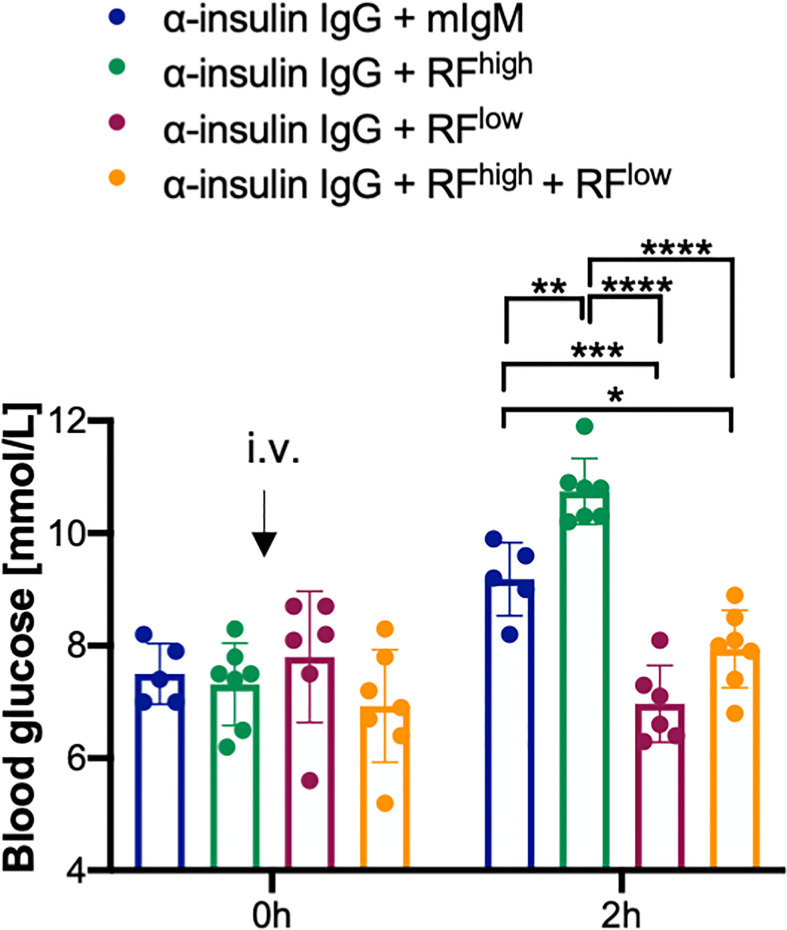
Figure 5.
RFlow prevails over RFhigh. Blood glucose concentrations of WT mice intravenously (i.v.) injected with 100 µg α-insulin IgG in combination with 20 µg RFhigh (green bar, n = 7), 20 µg RFlow (purple bar, n = 6), 20 µg RFlow + 20 µg RFhigh (orange bar, n = 7) or mIgM control (blue bar, n = 5) measured at indicated time points. Mean ± SD, statistical significance was calculated using two-way ANOVA with Tukey’s multiple comparisons test. *p < 0,05; **p < 0,01; ***p < 0,001; ****p < 0,0001.

