
Figure 4.
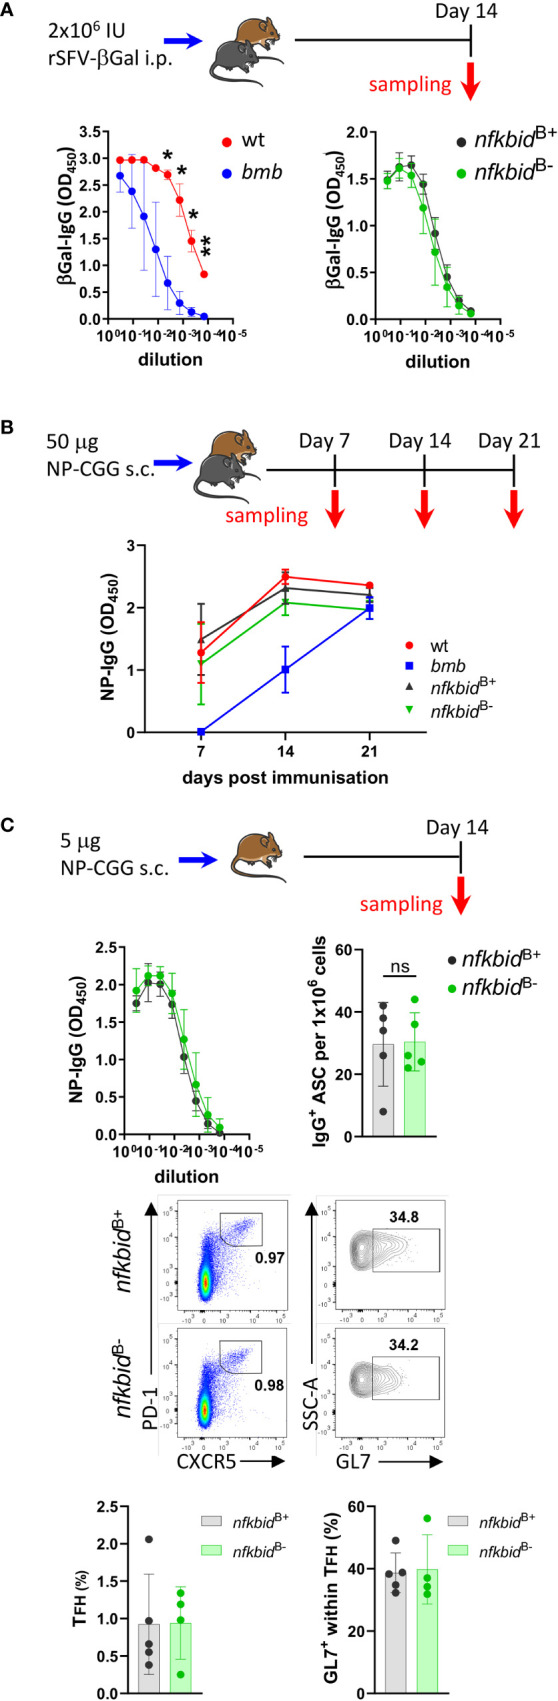
Intact T-dependent response in nfkbid B- conditional knock-out mice. (A) Mice were immunized with 2x10⁶ IU rSFV-βGal i.p. and anti-βGalactosidase IgG antibody responses were evaluated in serum from wt, bumble (bmb), nfkbid B+, and nfkbid B- mice 14 days post immunization. Symbols and error bars indicate mean ± SD. Data are representative of two independent experiments with 3-7 mice per group. (B) Mice were immunized with 25 µg NP-CGG in AddaVax s.c. in each flank (i.e. 50 µg NP-CGG in total per mouse), and NP-specific IgG production in serum from wt, bumble (bmb), nfkbid B+, and nfkbid B- mice evaluated 7, 14, and 21 post immunization. Symbols and error bars represent mean ± SD. Data is from one experiment with 5 mice per group. (C) nfkbid B+, and nfkbid B- mice were immunized with 2,5 µg NP-CGG in AddaVax s.c. in each flank (i.e. 5 µg NP-CGG in total per mouse), and NP-specific IgG response was evaluated 14 days post immunization. Symbols and error bars represent mean ± SD (upper left panel). NP-specific IgG-producing cells were enumerated using ELISpot assay 14 days post-immunization from splenic B cells. Graph shows frequencies of NP-specific IgG+ cells. Mean ± SD are plotted. Data is representative for two independent experiments with 3-5 mice per group (upper right panel). Representative flow cytometry plots showing gating on GL7+ CXCR5+ PD-1+ TFH cells in vivo in the immunized nfkbid B+ and nfkbid B- mice (middle panels). Frequencies of TFH cells and GL7+ TFH cells are shown (lower bar graphs). Bars and error bars indicate mean ± SD. Mouse pictures were created with https://BioRender.com. *P ≤0.05, **P ≤0.01, ns, not significant.