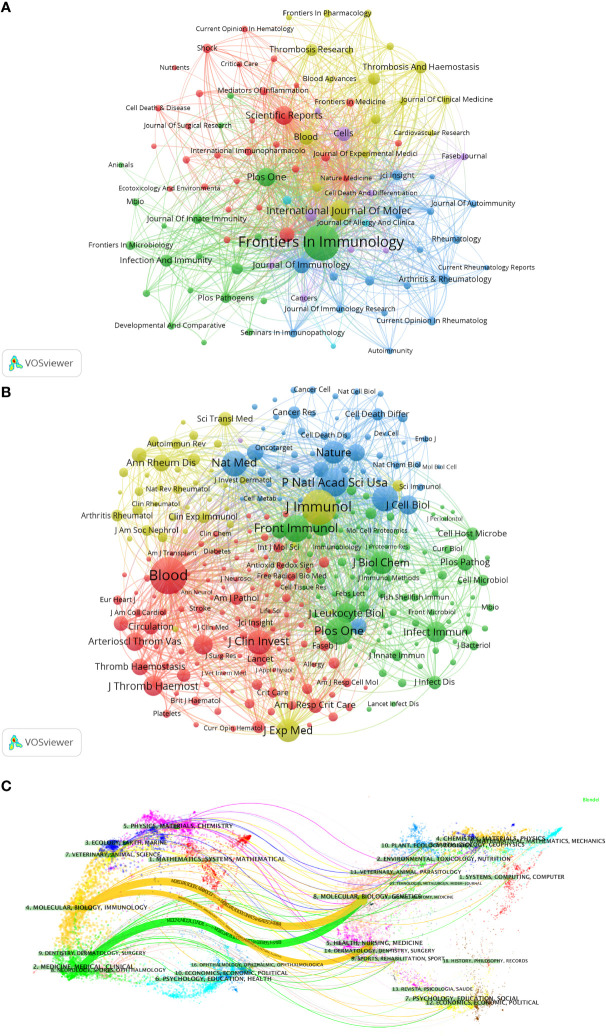
Figure 5.
Analysis of NETs-related journal. (A) Analysis of collaborative network visualization of journals in VOSviewer. The figure shows the journals with more than 10 documents. The nodes in different colors represent the journals in different clusters, and the size of the nodes indicates the frequency of their occurrence. (B) Analysis of collaborative network visualization of journals’ citations in VOSviewer. The size of the nodes indicates the frequency of their occurrence. (C) The dual-map overlay of journals. Citing journals are on the left, cited journals are on the right, and colored paths indicate citation relationships.

