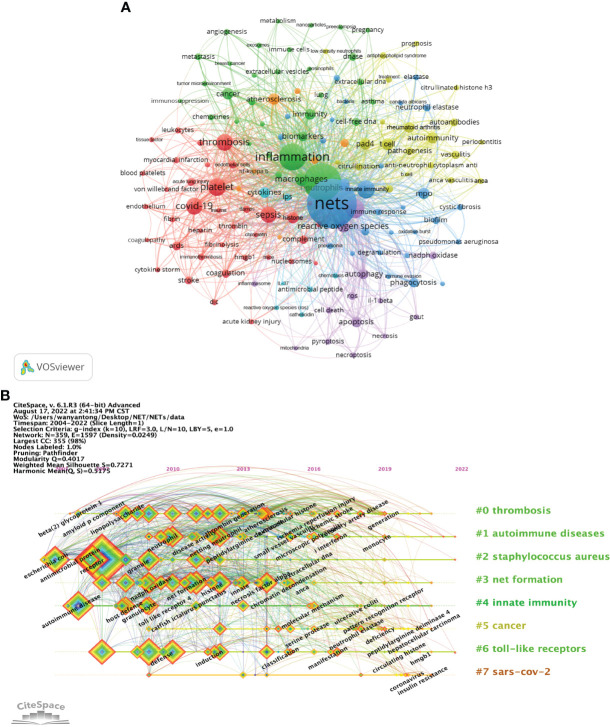
Figure 6.
Analysis of NETs-related keyword. (A) Collaborative network visualization of keywords in VOSviewer. The figure shows the keywords with more than 15 occurrences. The nodes of different colors represent the keywords of different clusters, and the size of nodes indicates their frequency. (B) Timeline view of keywords. Each horizontal line represents a cluster. The smaller the number is, the larger the cluster, with #0 being the largest cluster. Nodes size reflects co-citation frequency, and the links between nodes indicate co-citation relationships. Nodes occurrence year is the time when they were first co-cited.

