Figure 2.
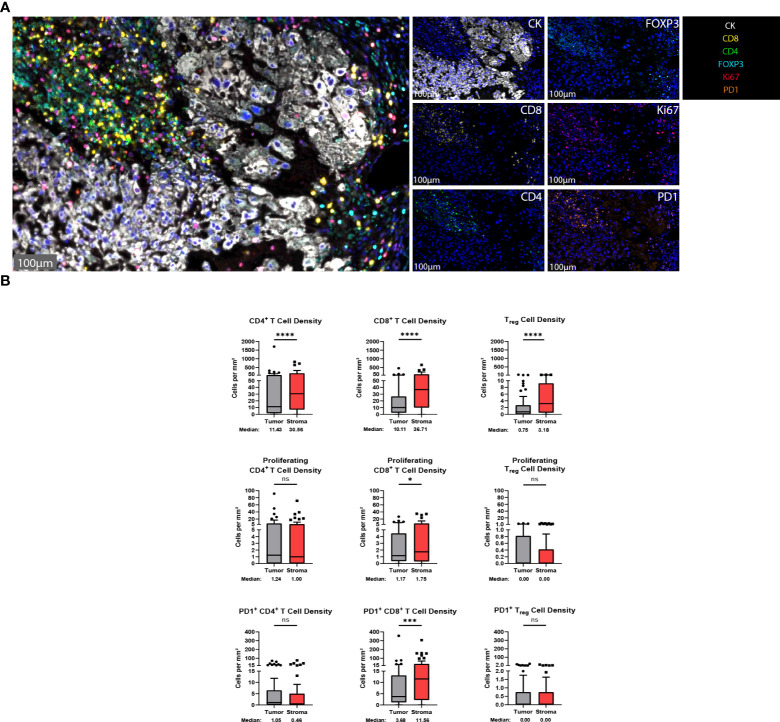
T cells are found in abundance within the chordoma tumor immune microenvironment, most often within the stroma. (A) Representative photomicrographs from one chordoma of merged and single-color immunofluorescence images assessing the presence of T cells with a validated panel of six biomarkers, CD8 (yellow, Opal 570), CD4 (green, Opal 520), FOXP3 (turquoise, Opal 480), Ki67 (red, Opal 690), PD1 (orange, Opal 620), and CK (white, Opal 780). Multispectral immunofluorescence images are counterstained with DAPI. Expression of CD4 without CD8 and FOXP3 identified CD4+ T helper cells, while expression of CD8 without CD4 and FOXP3 identified CD8+ cytotoxic effector T cells. Co-localization of CD4 and FOXP3 without CD8 identified Tregs. T cells with positive Ki67 nuclear expression were proliferating, and PD1 positivity denoted PD1+ T cells. Expression of CK identified chordoma tumor cells. (B) Quantification of CD4+ T cell, CD8+ T cell, and Treg cell density (per mm2), as well as proliferating and PD-1+ subcategories of these are compared between chordoma tumor and stroma (n = 57 individual tumors). Wilcoxon signed rank tests with p value threshold of <0.05 were used to compare tumor and stroma T cell infiltrate. *p ≤ 0.05, ***p ≤ 0.001, ****p ≤ 0.0001, ns, non significant. CK, cytokeratin; DAPI, 4′,6-diamidino-2- phenylindole; PD1, programmed cell death protein 1.

