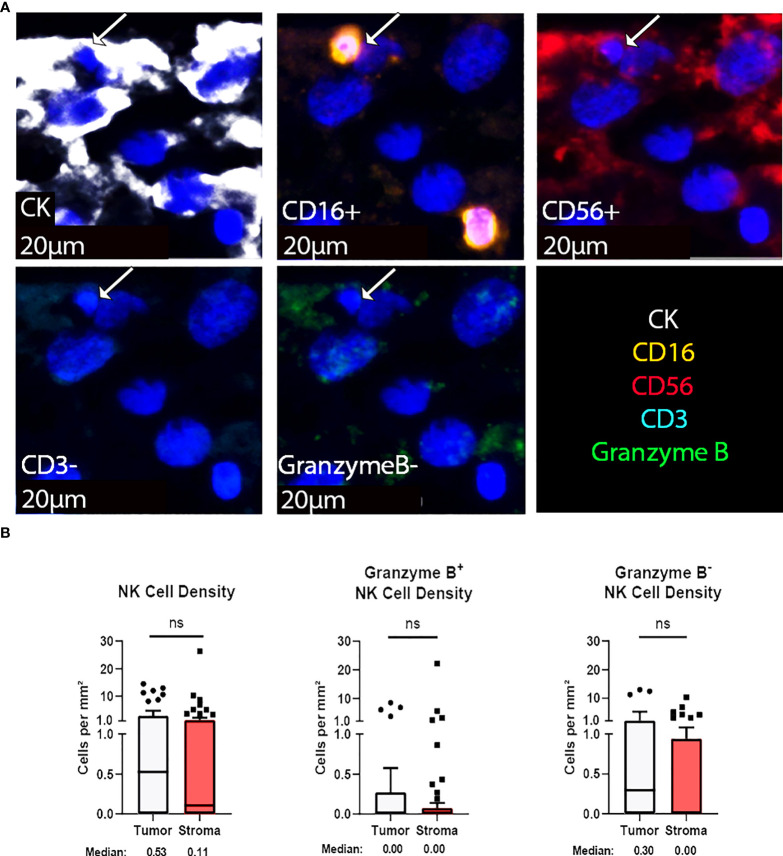
Figure 4.
NK cells are sparsely found within the chordoma tumor immune microenvironment. (A) Representative photomicrographs from one chordoma of merged and single-color immunofluorescence images assessing the presence of NK cells with a validated panel of five biomarkers, CD16 (orange, Opal 620), CD56 (red, Opal 690), CD3 (turquoise, Opal 480), Granzyme B (green, Opal 520), and CK (white, Opal 780). Multispectral immunofluorescence images are counterstained with DAPI. Co-localization of CD16 and CD56 without CD3 and a decrease size threshold compared to tumor cells identified NK cells. Expression of Granzyme B identified Granzyme B+ or Granzyme B- NK cells. Expression of CK identified chordoma tumor cells. (B) Quantification of NK cells overall, Granzyme B+, and Granzyme B- NK cells per mm2 in chordoma tumor and stroma (n = 54 individual tumors). Wilcoxon signed rank tests with p value threshold of <0.05 were used to compare tumor and stroma NK cell infiltrate. ns, non significant. NK cell, natural killer cell; CK, cytokeratin; DAPI, 4′,6-diamidino-2- phenylindole.

