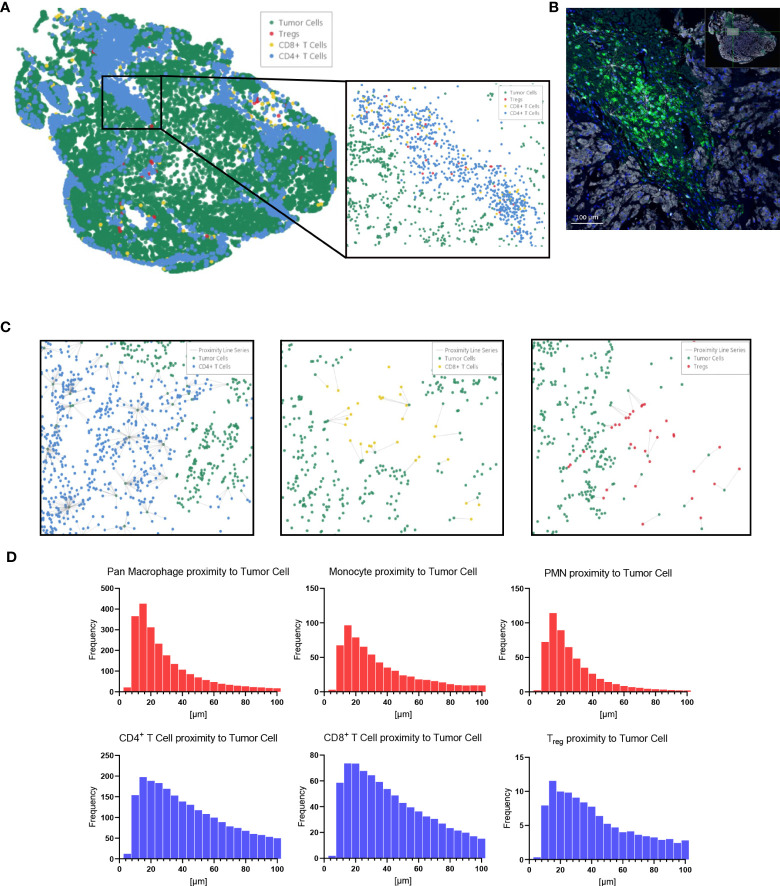
Figure 5.
HALO® spatial proximity analyses of immune cells to chordoma cells demonstrate that T cells are nearer than myeloid cells to tumor cells. (A) Sacral chordoma specimen with three categories of T cells, CD4+ T cells, CD8+ T cells, and Tregs shown in blue, yellow, and red respectively. Tumor cells are shown in green. A segment of heavy T cell infiltrate is magnified. (B) Real time proximity analysis between CD4+ T cells (green, Opal 520) and chordoma cells (white, Opal 780) with bars measuring distance between these superimposed on the image in white. (C) Proximity line series between T cells and chordoma tumor cells. (D) Proximity analysis histograms of myeloid cells (top row, red) and T cells (bottom row, blue) to chordoma tumor cells within a 100µm radius by progressive segments of 20µm bands (n = 56 individual tumors).

