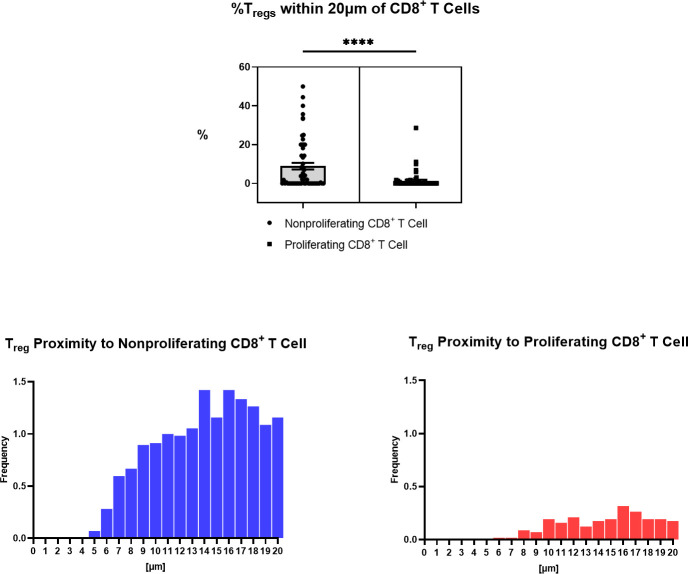
Figure 6.
Spatial characterization of distance between Tregs to proliferating and nonproliferating CD8+ T cells in chordoma tumor slides (n = 57). Percentage of Tregs within 20µm of nonproliferating CD8+ T cells (mean 8.90 ± SEM 1.74) is significantly greater than that within 20µm of proliferating CD8+ T cells (mean 1.34 ± SEM 0.57) (p < 0.0001), shown above. A Wilcoxon signed rank test with a p value threshold of <0.05 was used. ****p ≤ 0.0001. Proximity analysis histograms of Tregs within a 20µm radius of nonproliferating CD8+ T cells (left, blue) and proliferating CD8+ T cells (right, red) by progressive segments of 1µm bands, shown below.

