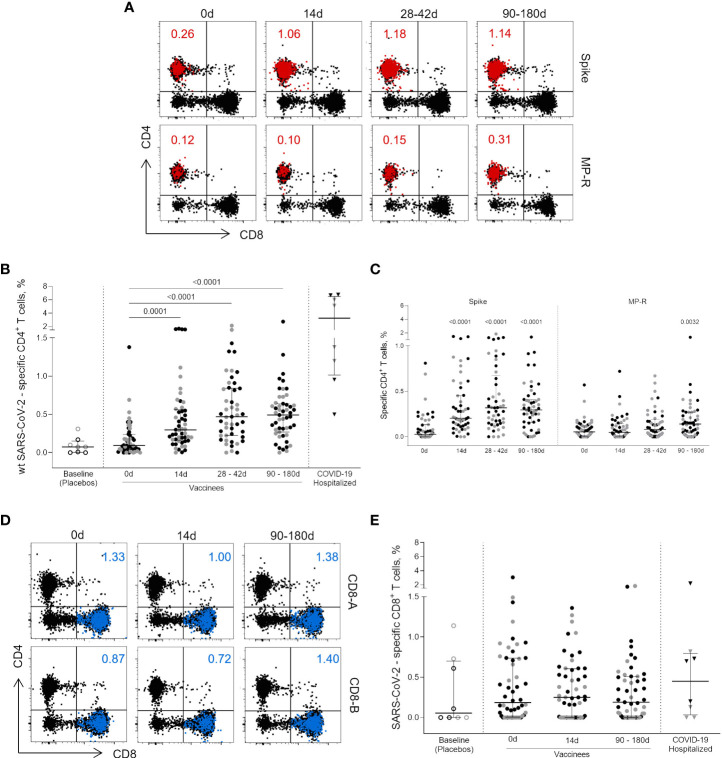
Figure 1.
CD4+ and CD8+ circulating T cells activated after vaccination. (A) Representative flow cytometry plots showing the activated (OX40+CD25+CD137+) CD4+ T cells (red dots) after the stimulation with Wuhan/WH04/2020 (wt) SARS-CoV-2 Spike and non-spike (MP-R) peptides megapools (MPs). The total response is presented as the sum values obtained for Spike- and non-Spike-specific CD4+ designed MPs. (B) Frequency of activated SARS-CoV-2-specific CD4+ T cells before and after first and second vaccine doses. (C) Frequency of activated SARS-CoV-2-specific Spike and non-Spike (MP-R) CD4+ T cells before and after the first and second vaccine doses. (D) Representative FlowJo analysis of activated (CD69+CD137+) CD8+ T cells (in blue) at three time points after stimulation with SARS-CoV-2 peptides MPs targeting most prominent HLA class I alleles (CD8-A and CD8-B) (E) Frequency of activated SARS-CoV-2-specific CD8+ T cells before and after the first and second vaccine doses. The percentage of activated cells was determined by using a Boolean gate on the total live CD4+ or CD8+ T cells. In the scatter dot plot graphs: symbol colours represent age-groups (black: 18-59, gray: ≥60); symbol shapes represent different volunteer sub-groups (unfilled circle: placebos (n = 8), filled circle: vaccinees (n = 52), filled triangles: SARS-CoV-2 infected hospitalized individuals (n = 8), 19 days median of symptoms onset (IQR 17-22)). 0d: vaccinees baseline, day of first vaccine dose (n = 52). 14d: two-weeks after the first dose, day of the second vaccine dose (n = 52). 28-42d: from 28 42 days after the first vaccine dose (n = 49). 90-180d: from 90 to 180 days after the first vaccine dose (n = 51). Three individuals missed the 28-42d visit, one individual was excluded at the latest visit due to the detection of SARS-CoV-2 infection and one was excluded due to lack of baseline PBMC sample. Statistical comparisons using the Kruskall-Wallis with post hoc Dunn’s test against baseline values were used.

