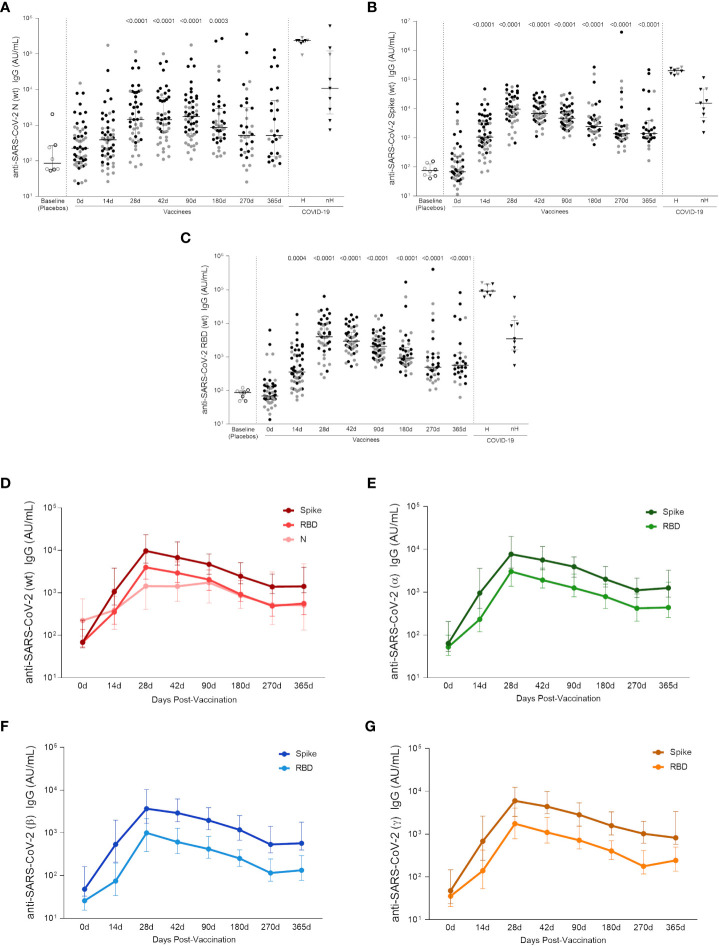
Figure 5.
Specific wt-SARS-CoV-2 and VOCs strains IgG titers. (A) IgG levels measured against Nucleocapsid, (B) Spike and (C) RBD proteins from the Wuhan/WH04/2020-SARS-CoV-2 (wt). (D) IgG titers against S, RBD and N proteins from the Wuhan/WH04/2020-SARS-CoV-2 (wt). IgG levels against Spike and RBD proteins from (E) Alpha (B.1.117), (F) Beta (B.1.351) and (G) Gamma (P.1) strains. In the scatter dot plot graphs: symbol colors represent age-groups (black: 18-59, gray: ≥ 60) and symbol shapes represent different volunteer sub-groups (unfilled circle: placebos (n = 8), filled circle: vaccinees (n = 53), filled triangles: SARS-CoV-2 infected hospitalized (n = 8) (19 days median of symptoms onset (IQR 17-22)) or non-hospitalized individuals (n = 9) (46 days median of symptoms onset (IQR 34-65)). In (D–G) values are expressed as the median and the 25-75% IQR. AU: arbitrary units. 0d: vaccinees baseline, day of first vaccine dose (n = 53). 14d: two-weeks after the first dose, day of the second vaccine dose (n = 53). 28d: four-weeks after the first vaccine dose (n = 46). 42d: six-weeks after the first vaccine dose (n = 47). 90d: three-months after the first vaccine dose (n = 52). 180d: six-months after the first vaccine dose (n = 41). 270d: nine-months after the first vaccine dose (n = 34). 365d: one-year after the first vaccine dose (n = 27). Seven individuals missed the 28d visit, six missed the 42d visit, ten missed the 180d visit, fourteen missed the 270d visit and twenty-one missed the 365d visit. One individual was excluded from the 90d visit, two from the 180d visit, five from the 270d visit and five from the 365d visit due to the detection of SARS-CoV-2 infection. Statistical comparisons using the Kruskall-Wallis with post hoc Dunn’s test against baseline values were used. See also Figure S4 .

