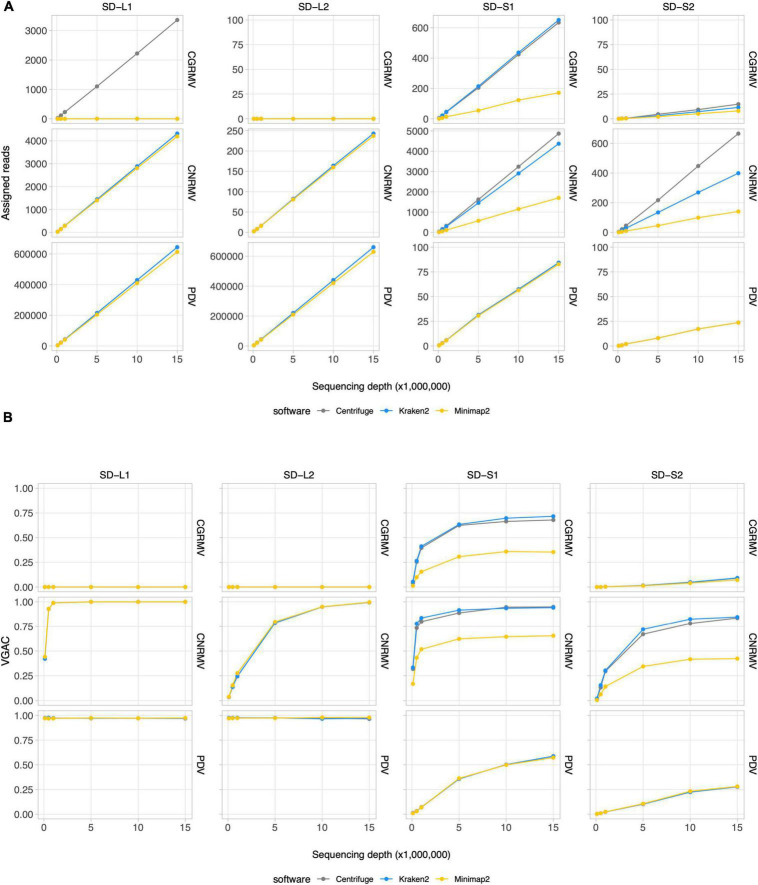
FIGURE 2.
Read assignment and assembly coverage with HTS data from field samples. Ten subsets of randomly selected reads from sequencing data for field samples of cherry plants at the shoot development stage (SD-L1, SD-L2, SD-S1, and SD-S2) were built at different depths of sequencing. Three bioinformatic algorithms were tested, namely Centrifuge, Kraken2, and Minimap2. All the dots represent the average of 10 measures. VGAC was calculated according to “Materials and methods” and with the reads assigned by the different algorithms at the respective depth of sequencing. (A) Read assignment at different depths of sequencing (note the different scales of the ordinates) using the Pavium panel-I. (B) VGAC obtained from the assembly of assigned reads (ranges from 0 to 1). Only the cases for CGRMV, CNRMV, and PDV are presented, but full versions containing all of the target viruses are depicted in Supplementary Figures 1, 2. Average values (dots) as well as standard deviations are listed in Supplementary Table 11. SD, shoot development stage; VGAC, viral genome assembly coverage; CGRMV, cherry green ring mottle virus; CNRMV, cherry necrotic rusty mottle virus; PDV, prune dwarf virus.

