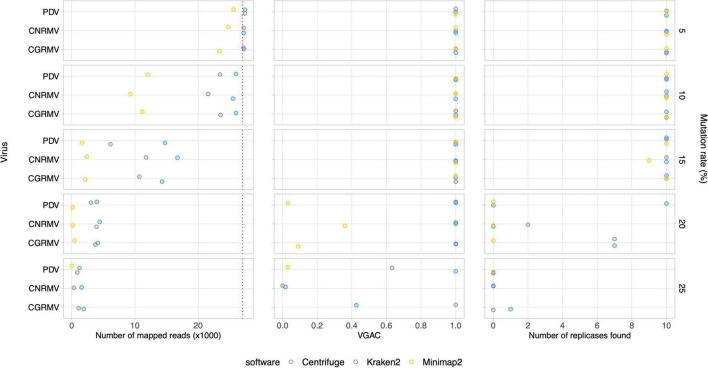
FIGURE 4.
Simulated mutations in synthetic HTS data. Mutated virus genomes were simulated to generate synthetic HTS dataset to evaluate read assignment tolerance to viral mutated variants. Each viral genome of the Pavium panel-I was randomly mutated at the different rates indicated (5, 10, 15, 20, and 25%) at the far right of each chart. Albeit 20 million reads were generated for each mutation rate, a 10× subsampling of 10 million reads was performed, so dots represent a mean number of assigned reads. The distribution of viral reads in this case was homogeneous. The cases of viruses CGRMV (cherry green ring mottle virus), CNRMV (cherry necrotic rusty mottle virus) and PDV (prune dwarf virus) are shown, but a full version of this figure is depicted in Supplementary Figure 4. Dotted red line: expected number of assigned (mapped) reads according to the distribution of reads. Average values (dots) as well as standard deviations are listed in Supplementary Table 11.

