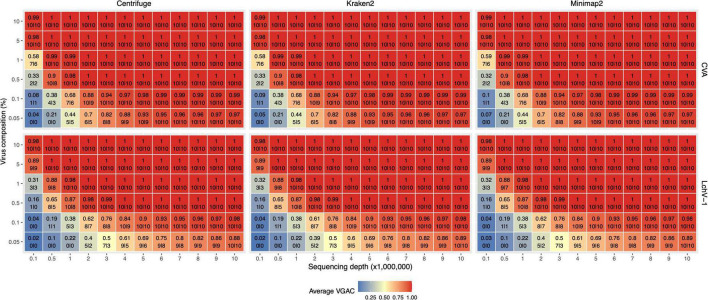
FIGURE 5.
VGAC dependence on viral abundance, depth of sequencing and identification of replicases. In order to analyze the relationship of VGAC (viral genome assembly coverage) on viral abundance, depth of sequencing and the presence of replicases, synthetic HTS data were generated with different abundance of viral reads. The viruses with the shortest and the longest genome length of the Pavium panel-I were assayed only [CVA (cherry virus A) and LChV-1 (little cherry virus 1) respectively]. The heatmap represents the VGAC obtained (indicated in each cell in the upper value) at both the respective sequencing depth and the abundance (%) of the viral reads (represented in the vertical axis as% viral composition of the corresponding 3% of viral reads of the sequencing depth); bottom numbers inside a cell indicates the number of replicases found in the respective assembly of the 10 subsampled sets at 80% alignment length/80% similarity, and 90% alignment length/90% similarity (both numbers separated by a pipe symbol).

