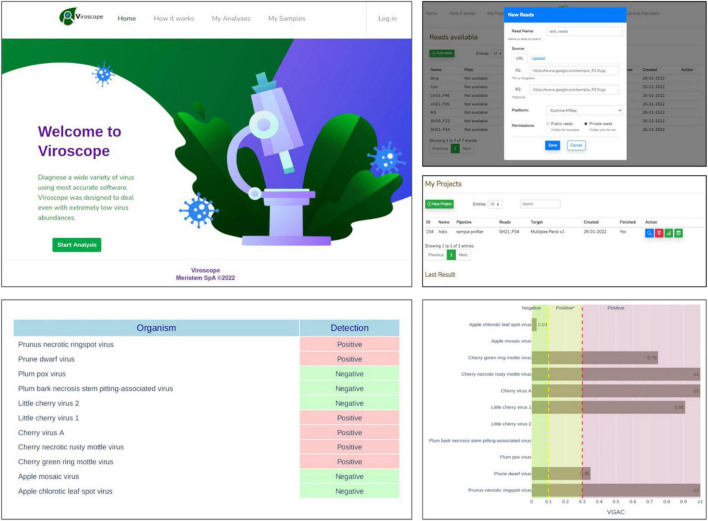
FIGURE 9.
Viroscope.io. The Viroscope web application enables virus plant diagnostics using HTS data. It provides a user-interface to perform the Viroscope pipeline, and yields the VGAC (viral genome assembly coverage) metric as well as the presence of replicases to interpret the data and perform diagnosis. The process involves uploading HTS reads into the read library, selecting an analysis against a specific viral panel using user-inputted thresholds. This generates the analysis which is processed in real-time. The analysis then displays the results in plots that provide the metrics and suggests the diagnosis according to the selected thresholds, which is then confirmed by the user. The background image for the Viroscope.io web app was purchased at Shutterstock.com under a standard license.

