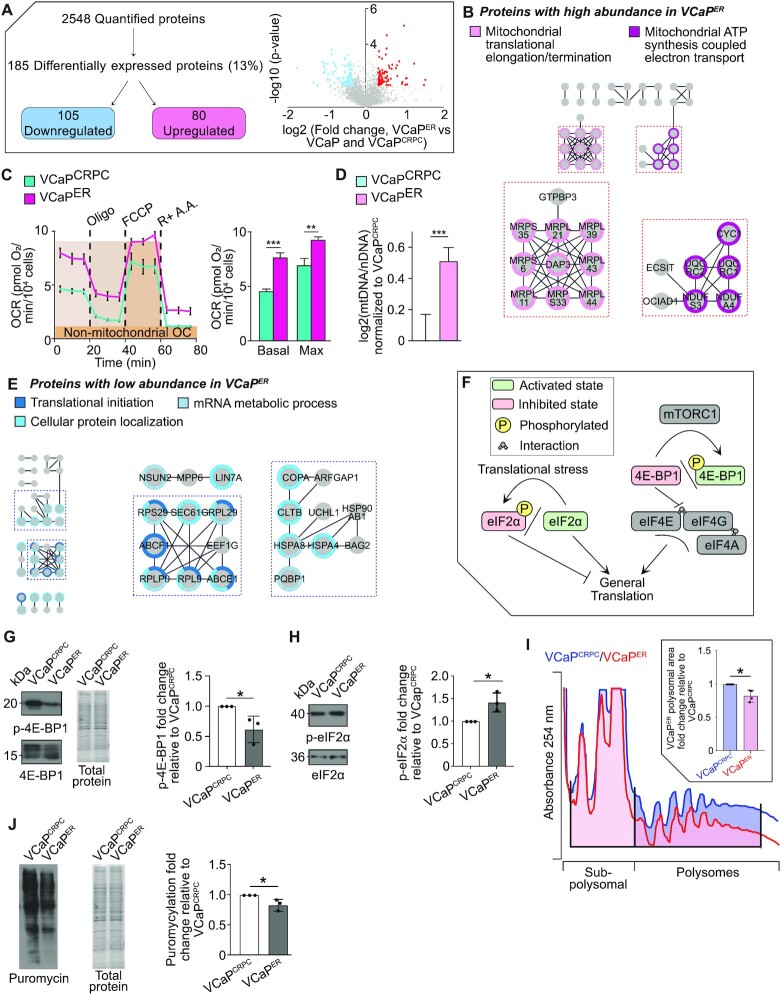
Figure 2.
VCaPER are characterized by increased mitochondrial activity and decreased translation. (A) Mass spectrometry analysis showing differentially expressed proteins in VCaPER cells compared to VCaPCRPC and VCaP (left). Volcano plot showing fold change between VCaPER cells and VCaPCRPC (right). Significantly up- and downregulated proteins are marked by red and blue dots respectively. (B) Network analysis showing clusters formed by proteins highly expressed in VCaPER compared to VCaPCRPC. Main clusters are identified and highlighted in pink. (C) OCR of VCaPER and VCaPCRPC cells during mitochondrial stress test (left) and basal and maximal OCR in VCaPCRPC and VCaPER (right). Results are shown as the average and standard error of the mean (SEM) of 3 independent experiments performed in triplicates. (D) Mitochondrial DNA and nuclear DNA ratio in VCaPCRPC and VCaPER cells. Results are shown as the logged average and SEM of 3 independent experiments performed in triplicates, normalized to VCaPCRPC. (E) Network analysis shows clusters formed by proteins lowly expressed in VCaPER compared to VCaPCRPC and VCaP. Main clusters are identified and highlighted in blue. (F) Schematic of the effect of eIF2α and 4E-BP1 phosphorylation on translation. (G) Western-blot showing phosphorylation of 4E-BP1 and (H) eIF2α in VCaPCRPC and VCaPER cell lines (left). Quantification of signal intensities (right), relative to VCaPCRPC. 4E-BP1 was normalized to total protein and p-eIF2α, to eIF2α. n = 3 biological replicates. (I) Polysomal profiles of VCaPCRPC (blue) and VCaPER (red) (left) and quantification of area under curve of polysomal area (top right), normalized to sub-polysomal area and relative to VCaPCRPC. n = 4 biological replicates. (J) Puromycylation assay on VCaPCRPC and VCaPER cell lines (left) and quantification (right) relative to VCaPCRPC and normalized to total protein. n = 3 biological replicates. *P-value < 0.05

