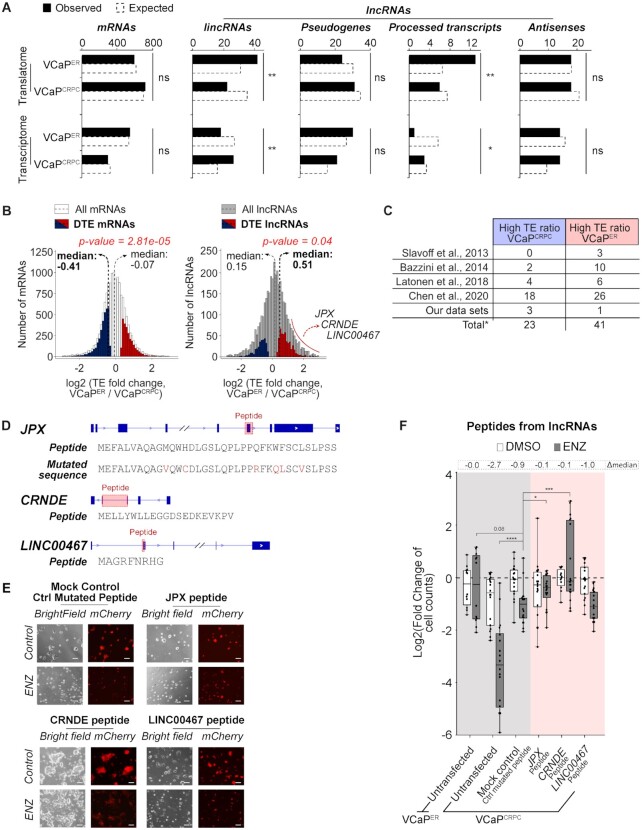
Figure 4.
lncRNAs associate to ribosomes and drive ENZ resistance in VCaPER. (A) Observed and expected gene counts for different categories of genes in the translatome and transcriptome RNA-seq of VCaPER compared to VCaPCRPC. (B) TE ratio distributions for mRNAs and lncRNAs. Significantly different TE ratios in VCaPER compared to VCaPCRPC are highlighted (red for higher and blue for lower TE ratio). Medians are indicated with dashed lines (thin lines for all genes, bold line for genes with significant differences in TE ratio). (C) Table of number of lncRNAs detected as peptides in peptidomics datasets. *Total values account for lncRNAs detected in multiple studies. (D) Schematic of lncRNA candidates and sequences of their putative peptides. Red boxes indicate putative peptide-coding regions. (E) Representative pictures of VCaPCRPC cell lines overexpressing putative peptide-coding sequences from candidate lncRNAs, or appropriate controls. Scale bar: 100 uM. (F) Fold changes of viable cell counts for cell lines overexpressing candidate lncRNAs with ENZ treatment normalized to control without ENZ treatment. Differences between ENZ-treated and control in log2(fold changes) are indicated as Δmedian. n = 2 or 3 biological replicates. *P-value < 0.05; **P-value < 0.01; ***P-value < 0.001; ****P-value < 0.0001. Only significant comparisons are shown.

