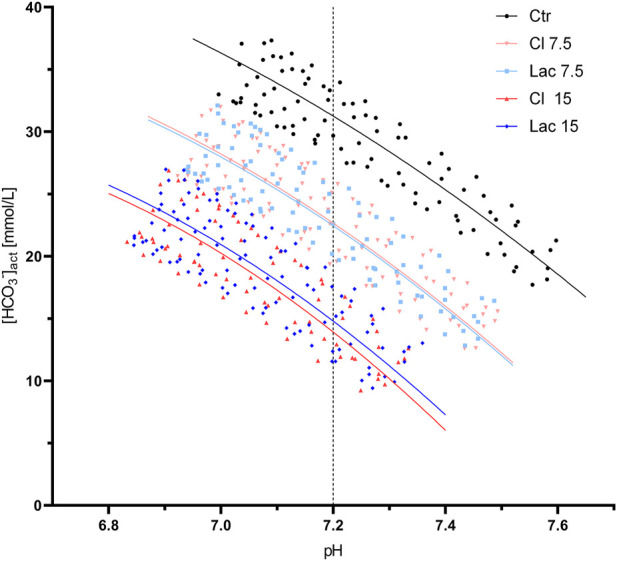
FIGURE 1.

All valid pH/[HCO3 −] data points obtained during the CO2 tonometry of the aliquots treated with the different stock solutions. Best-fit quadratic regression curve is shown for each group of aliquots. The pH of 7.2, at which βNC was calculated, is marked by a dashed line.
