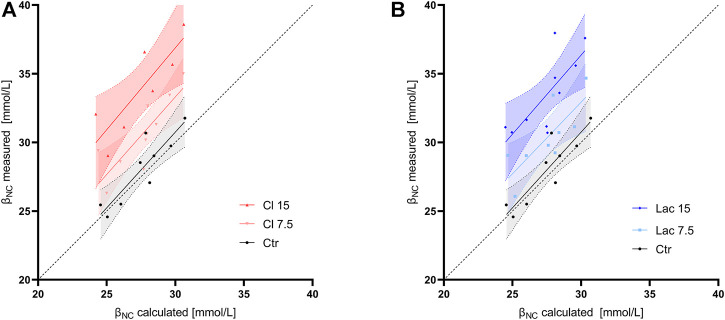
FIGURE 3.
Noncarbonic buffer power calculated according to formula used in the Van Slyke equation (βNC calculated) vs. the value measured using CO2 tonometry at a pH of 7.2 (βNC measured). Linear regression line and its 95% confidence interval are shown for each group of aliquots. The dashed line is the line of identity. (A) The control aliquot and aliquots with induced hyperchloremic acidosis. (B) The control aliquot and aliquots with induced lactic acidosis.

