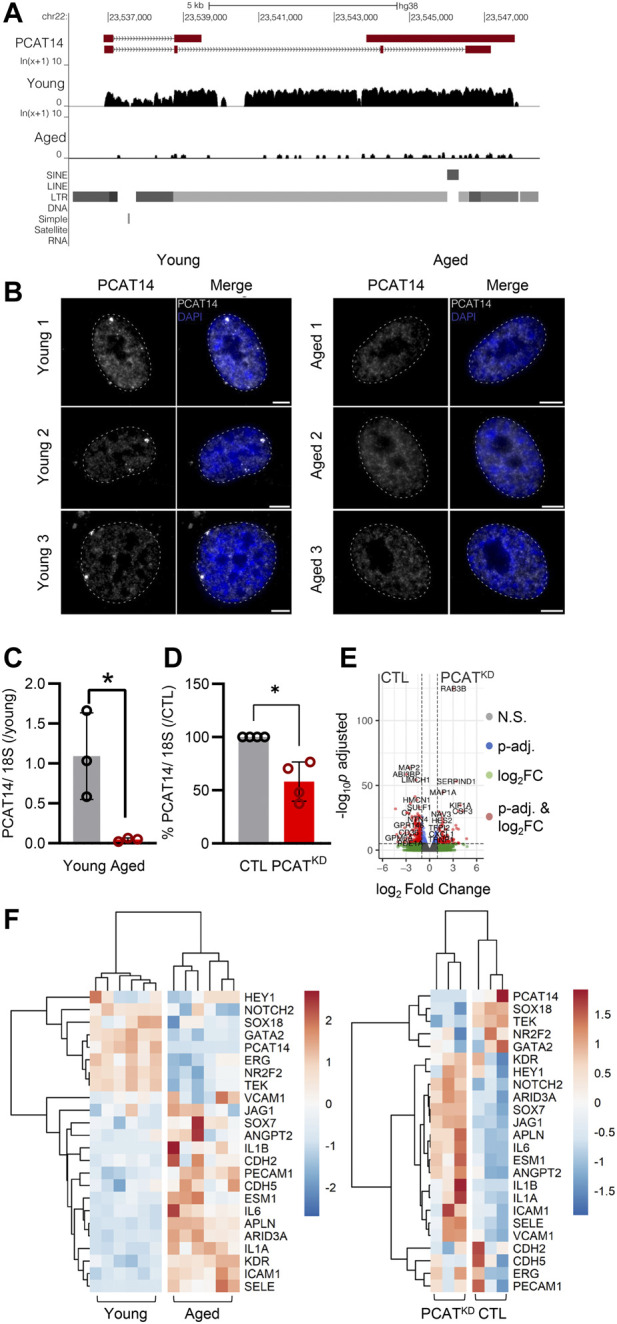
FIGURE 2.

PCAT14 expression, localization and impact on endothelial cell transcriptome. (A) UCSC Genome Browser showing the PCAT14 locus (hg38) and the poly (A)+ RNA-seq tracks from young and aged human native endothelial cells. (B) Maximum intensity projections of representative images of PCAT14 smRNA FISH on young and aged human native endothelial cells. Exon, gray; nucleus, blue, outlined with a dashed circle. Scale bar = 5 μm. RNA FISH was performed on 7 young and 4 aged samples. (C) Relative lncRNA levels of PCAT14 in young and aged native isolated arterial endothelial cells (n=3 per group, *p<0.05, Student’s t-test). (D) Relative PCAT14 expression normalized to CTL in Human umbilical vein endothelial cells (HUVEC, Passage 3) were transfected with GapmeR (50 nmol/L, 72 h) targeting PCAT14 (PCATKD) or a respective control (CTL). (E) Representative volcano plots showing differentially expressed transcripts (total variables = 22,059) in samples as in Figure 1D. (F) Hierarchical clustering heatmap showing the differentially expressed levels of PCAT14, endothelial and inflammatory markers in human native young and aged arterial endothelial cells (n=6 per group, each sample is a pool of 5 different isolations) and in human umbilical vein endothelial cells CTL or PCATKD as in (D). N.S: Not Significant; log2FC: log2 (Fold Change); p-val: p-value.
