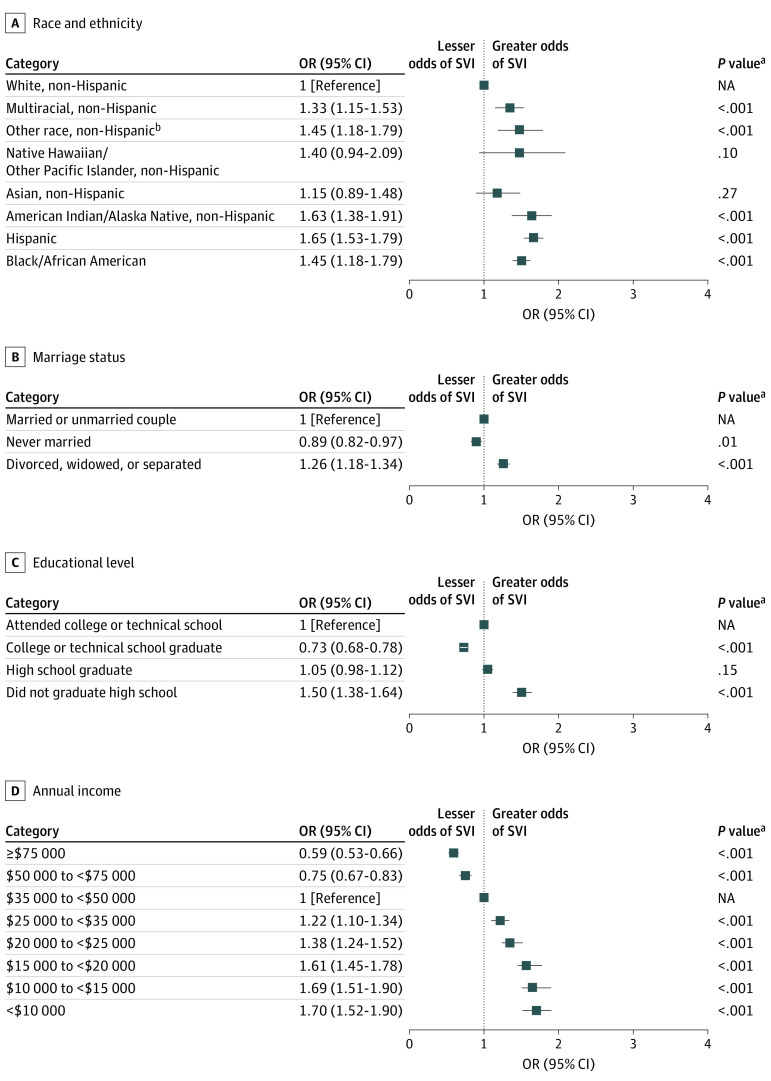
Figure 1. Odds of Severe Visual Impairment (SVI) Stratified by Race and Ethnicity, Marriage Status, Educational Level, and Annual Income.
Markers indicate odds ratios (ORs), with horizontal lines indicating 95% CIs. NA indicates not applicable.
aNo mathematical correction was made for multiple comparisons.
bOther race and ethnicity was not detailed further in the database.

