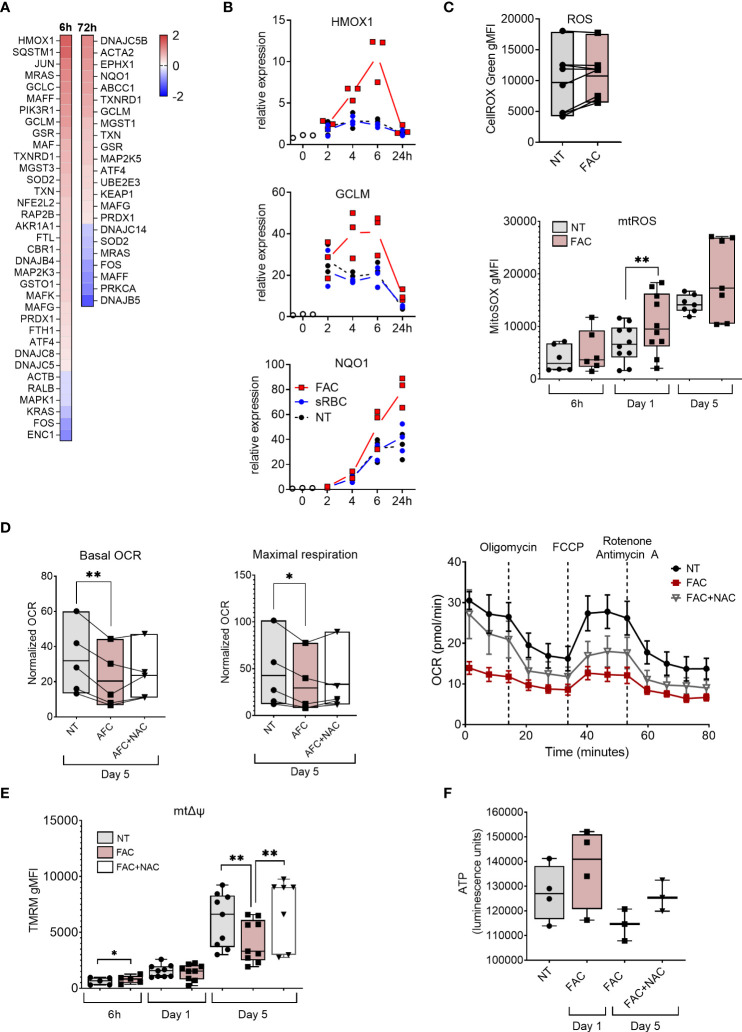
Figure 2.
Iron overload upregulates oxidative stress response genes and induces mtROS production and mitochondrial dysfunction. (A) Heatmap depicting Log2 fold change of NRF2-mediated oxidative stress response genes in monocytes cultured with M-CSF and FAC (4 µg Fe/mL) for 6h or 72h compared to monocytes cultured with only M-CSF (B) mRNA expression relative to 0h of NRF2-regulated genes in monocytes cultured with M-CSF and FAC (4 µg Fe/mL) or sRBC for 0-24 h. (C) FACS analysis of cellular ROS at day 5 (n = 8) and of mtROS production (n = 6-10) at indicated time points, in monocytes differentiated with M-CSF in the presence of FAC (4 µg Fe/mL) (D) Basal oxygen consumption rate (OCR) and maximal respiration in monocytes differentiated with M-CSF in the presence of FAC (4 µg Fe/mL) for 5 days. Cells were also treated with a combination of FAC (4 µg Fe/mL) and N-acetyl-L-cysteine (NAC, 4mM) for 5 days. A representative OCR analysis of monocytes from one single donor is also shown. (E) FACS analysis of mitochondrial membrane potential (mΔψ) in monocytes differentiated with M-CSF in the presence of FAC (4 µg Fe/mL) for 6h, 1 day and 5 days or a combination of FAC (4 µg Fe/mL) and NAC (4mM) for 5 days (n = 6-8). (F) ATP quantification in monocytes differentiated with M-CSF in the presence of FAC (4 µg Fe/mL) for 1 day of 5 days or in the presence of a combination of FAC (4 µg Fe/mL) and NAC (4mM) for 5 days (n = 3-4). Data are presented as luminescence units. (C-F) Each dot represents an individual donor. One-way ANOVA with Dunnett’s multiple comparisons test was performed. *p < 0.05, **p < 0.01.

