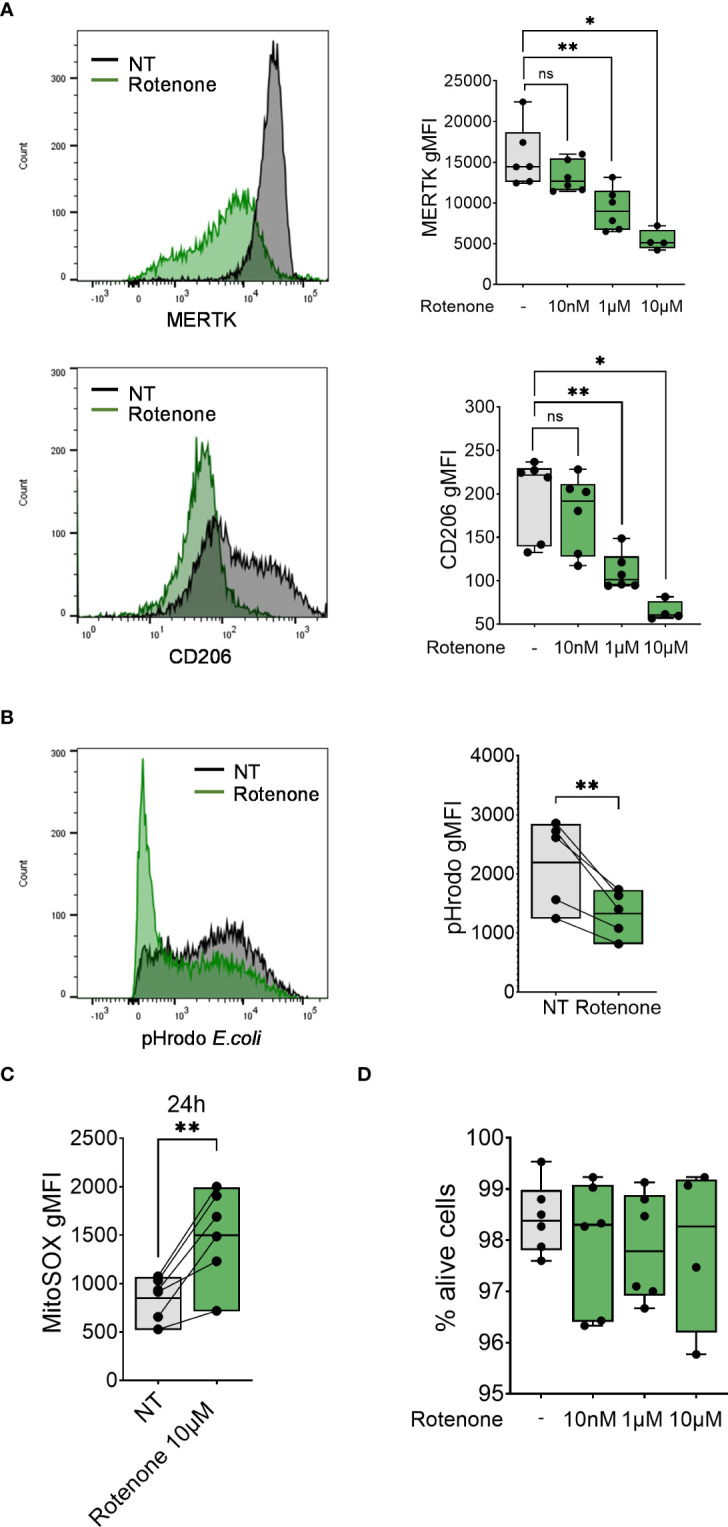
Figure 4.

Rotenone induces mtROS production and impairment of monocyte-to-macrophage differentiation. (A) Surface expression of indicated markers analyzed on monocyte differentiated with M-CSF in the presence of rotenone (10nM-10µM) for 1 day. Each symbol represents an individual donor (n = 4-6). Data shown are pooled from three experiments. (B) Phagocytic capacity of monocytes differentiated with M-CSF in the presence of 10µM rotenone for 1 day, represented as pHrodo E.coli bioparticle gMFI. Each dot represents an individual donor (n = 6). Data shown are pooled from three experiments. (C) Quantification of mtROS production in monocytes differentiated with M-CSF and treated with rotenone 10µM for 24h (n = 6). Data are presented as MitoSOX gMFI. (D) FACS analysis of the percentage of viable monocytes (taken as Zombie Green negative cells) differentiated with M-CSF and treated with rotenone for 1 day. Each symbol represents an individual donor. (A-C) One-way ANOVA with Dunnett’s multiple comparisons test was performed. ns, not significant, *p < 0.05, **p < 0.01.
