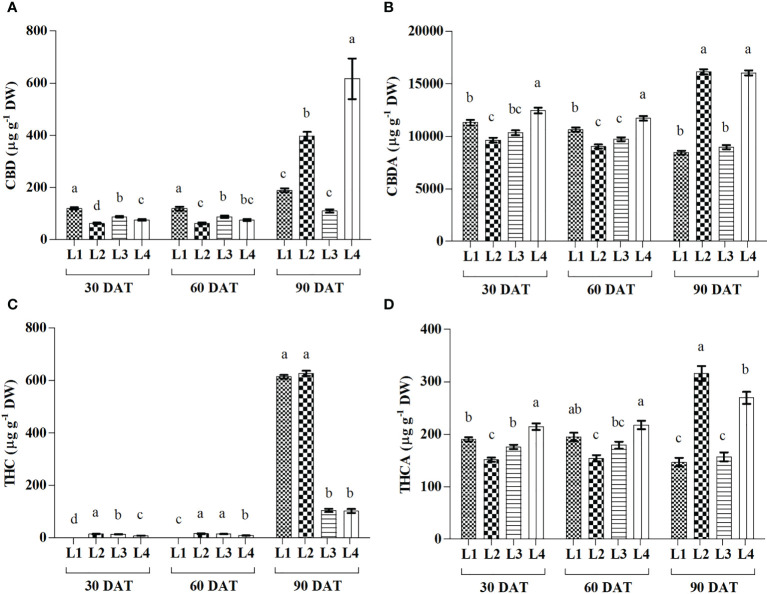
Figure 7.
Effect of LED spectra on cannabidiol (CBD) (A), cannabidiolicacid (CBDA) (B), tetrahydrocannabinol (THC) (C) and tetrahydrocannabinolic acid (THCA) (D) of hemp seedlings at 30, 60, and 90 DAT. Here and subsequent figures: L1, MW 240 (Red 35% + Blue 25% + Green 40%); L2, FS 240-UV (Red 40% + UVA and Blue 26% + Green 29% + Far red 5%); L3, MB 240 (Red 85% + Blue 15%); L4, PF 240 (Red 70% + Blue 30%); ND, not detected. All treatments used a photosynthetic photon flux density of 300 µmol m−2 s−1. Column height indicates the mean, vertical bars indicate the standard error of the mean (n = 4), and different letters indicate significant differences at p < 0.05.

