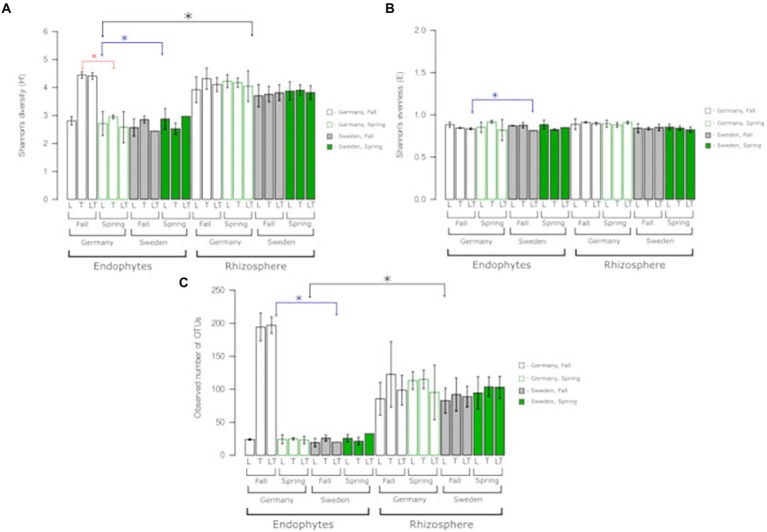
Figure 3.
Bacterial species richness, diversity, and evenness across two experimental sites, rhizosphere soil and roots. OTUs were constructed at 0.03 dissimilarity for bacterial sequences. (A) Shannon’s (H), (B) Shannon’s (E), (C) observed number of OTUs. Robust ANOVA with Tukey’s post-hoc analysis was used to assess the significance of differences between experimental sites, rhizosphere soil, and roots. Colours denote the following: black – significant difference between endophytes/rhizosphere, blue – significant differences between sites, red-significant difference between seasons. ∗Indicates a significant difference between variants indicated by arrows.

