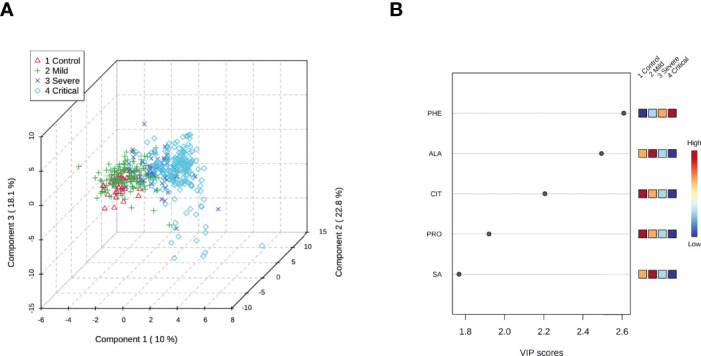
Figure 2.

Three-dimensional score plot of selected components. (A) Partial least squares-discriminant analysis plot of differential metabolites from HS and patients with mild, severe, and critical COVID-19. The explained variances are shown in parentheses. (B) Metabolites with a variable importance in projection (VIP) score >1.5. The intensities of colors in boxes to the right (from blue to red) indicate the relative concentrations of the corresponding metabolite in each group under study. HS= healthy subjects. PHE, Phenylalanine; ALA, Alanine; CIT, Citrulline; PRO, Proline; SA, succinylacetone.
