
Figure 3. RD Estimates for Each Quarter.
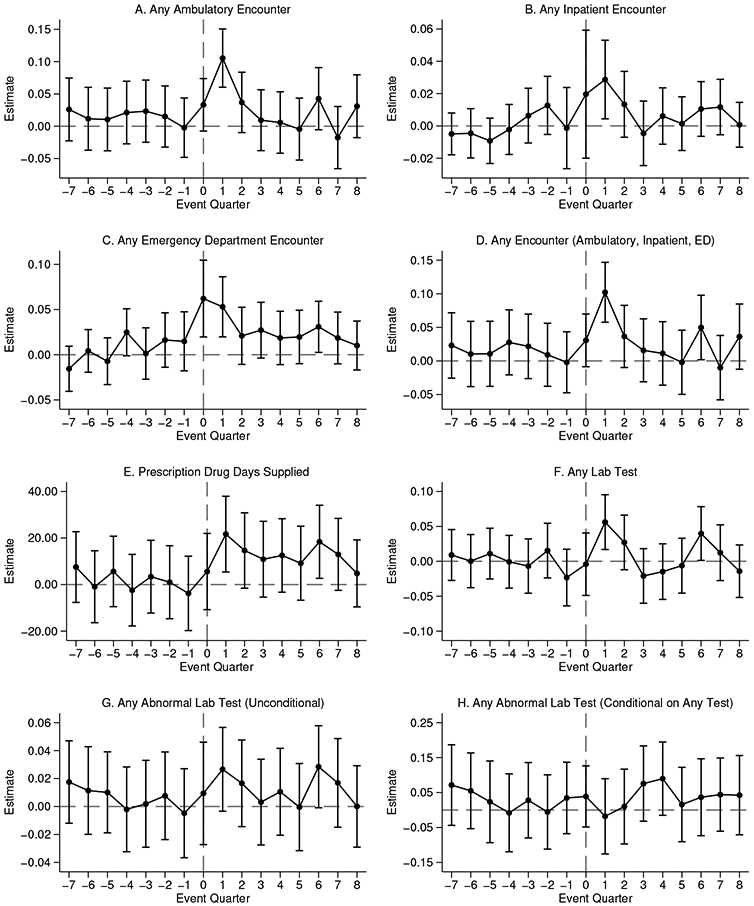
Note: Plots show regression discontinuity estimates, and the corresponding 95% confidence intervals, of the impact of financial assistance for quarters t ϵ [−7, 8]. Event quarter 0 corresponds to event months 0, −1, and −2 relative to the month of the application decision. Prescription Drug Days Supplied is winsorized at the 95th percentile.