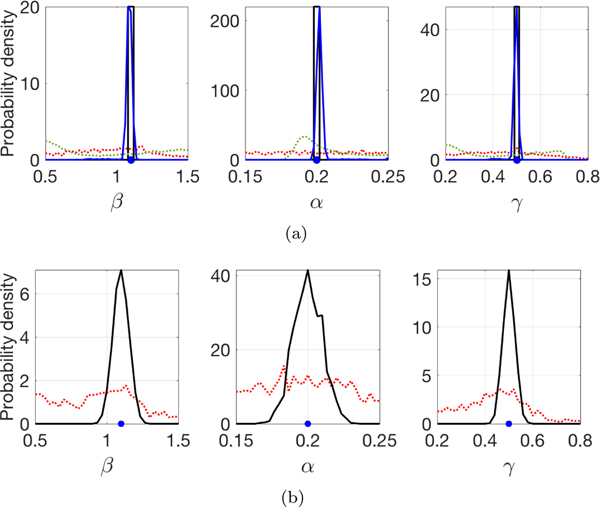
Fig. 2.
Histograms of estimated parameters from I(t), collected from the time intervals [0, 50] and [50, 100]. The SEIR model has β = 1.5, α = 0.2, γ = 0.5, and I(t) was used as input to two different algorithms. The blue dot denotes exact values. (a) Parameters from I(t) generated by deterministic SEIR. The red (dotted) and black traces use I(t) from [0, 50] and [50, 100], respectively, by minimizing L(β, α, γ) from 1000 different trajectories of the deterministic SEIR model. The green (dotted) and blue traces are marginals of the posterior density computed from MCMC using I(t) from [0, 50] and [50, 100], respectively. (b) Parameters from I(t) generated by stochastic SEIR. The red and black traces use I(t) from [0, 50] and [50, 100], respectively as in (a), by minimizing L(β, α, γ). The MCMC method is not represented in (b), since it would likely be computationally intractable. (Color available online.)

