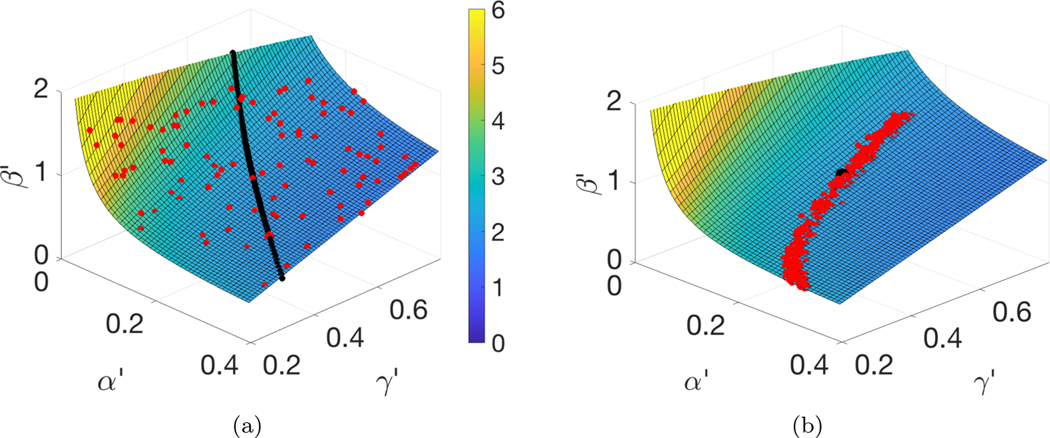
Fig. 5.
The unidentifiability surface defined by (3.8). (a) The red plotted points are the parameter values that minimized (landed in the smallest 1% of values of) the loss function L(β, α, γ) from the stochastic nonlinear SEIR model (2.1) trained on I(t) from the time interval [0, 50]. They are in remarkable agreement with the quadric surface (3.8) generated by the “exactly proportional” solutions. The black curve represents the parameter sets that generate the “approximately proportional” solutions from (3.4). The color on the surface corresponds to the computed . (b) MCMC using I(t) on [0, 50] from the deterministic version of the nonlinear SEIR (2.1) to sample the posterior (red dots). The parameter sets all lie on the surface (3.8). The true parameters are represented by the black dot. (Color available online.)

