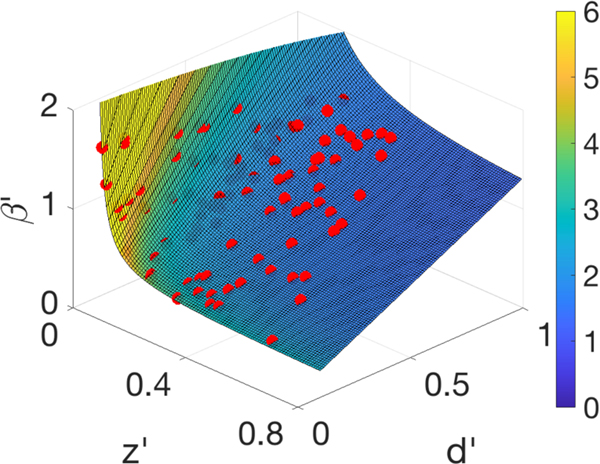
Fig. 9.
The unidentifiability surface defined by (5.6). The red plotted points are the parameter values that minimized (landed in the smallest 1% of values of) the loss function from the nonlinear SEUIR model (5.2), where w′ = w = 0.2 was assumed known. The parameters generating the input I(t) were . The input I (t) was used from the prepeak time interval [0, 50]. The surface is colored corresponding to R0. (Color available online.)

