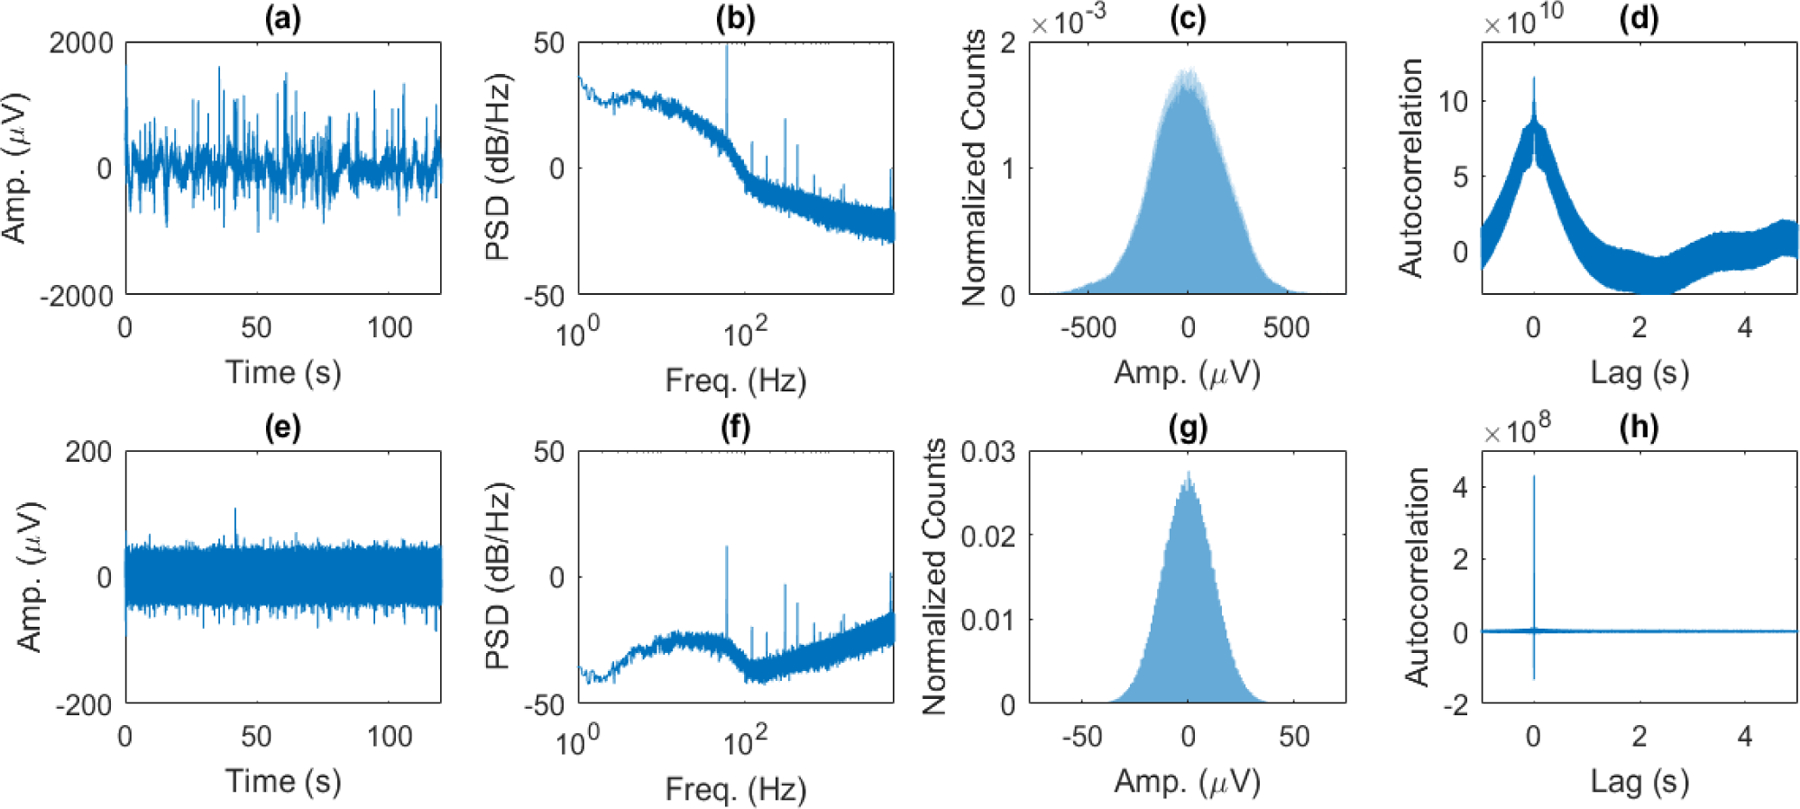
Fig. 2.

(a) Amplitude of EFP vs. time, (b) power spectral density (PSD) estimate from 1–6000 Hz, (c) normalized histogram of amplitudes, and (d) autocorrelation of spontaneous EFP. (e) Amplitude of first difference of EFP vs. time, (f) PSD estimate, (g) normalized histogram of amplitudes, and (h) autocorrelation of first difference of EFP. The PSD of the extracellular neural signal follows an approximately 1/f profile in the LFP range (1–300 Hz) and then begins to flatten in the higher frequency EAP range (b). The PSD is flattened significantly towards a constant level in the LFP range when taking the first difference in the time domain, which acts as a high-pass filter through frequency scaling in the Fourier domain, and places more emphasis on the EAP range (f). Additionally, the probability density function of the first difference is normally distributed (g), and its autocorrelation becomes nearly a delta function (h). Taking the first difference of the EFP transforms the signal into one that is closer to Gaussian white noise.
