
Fig. 2.
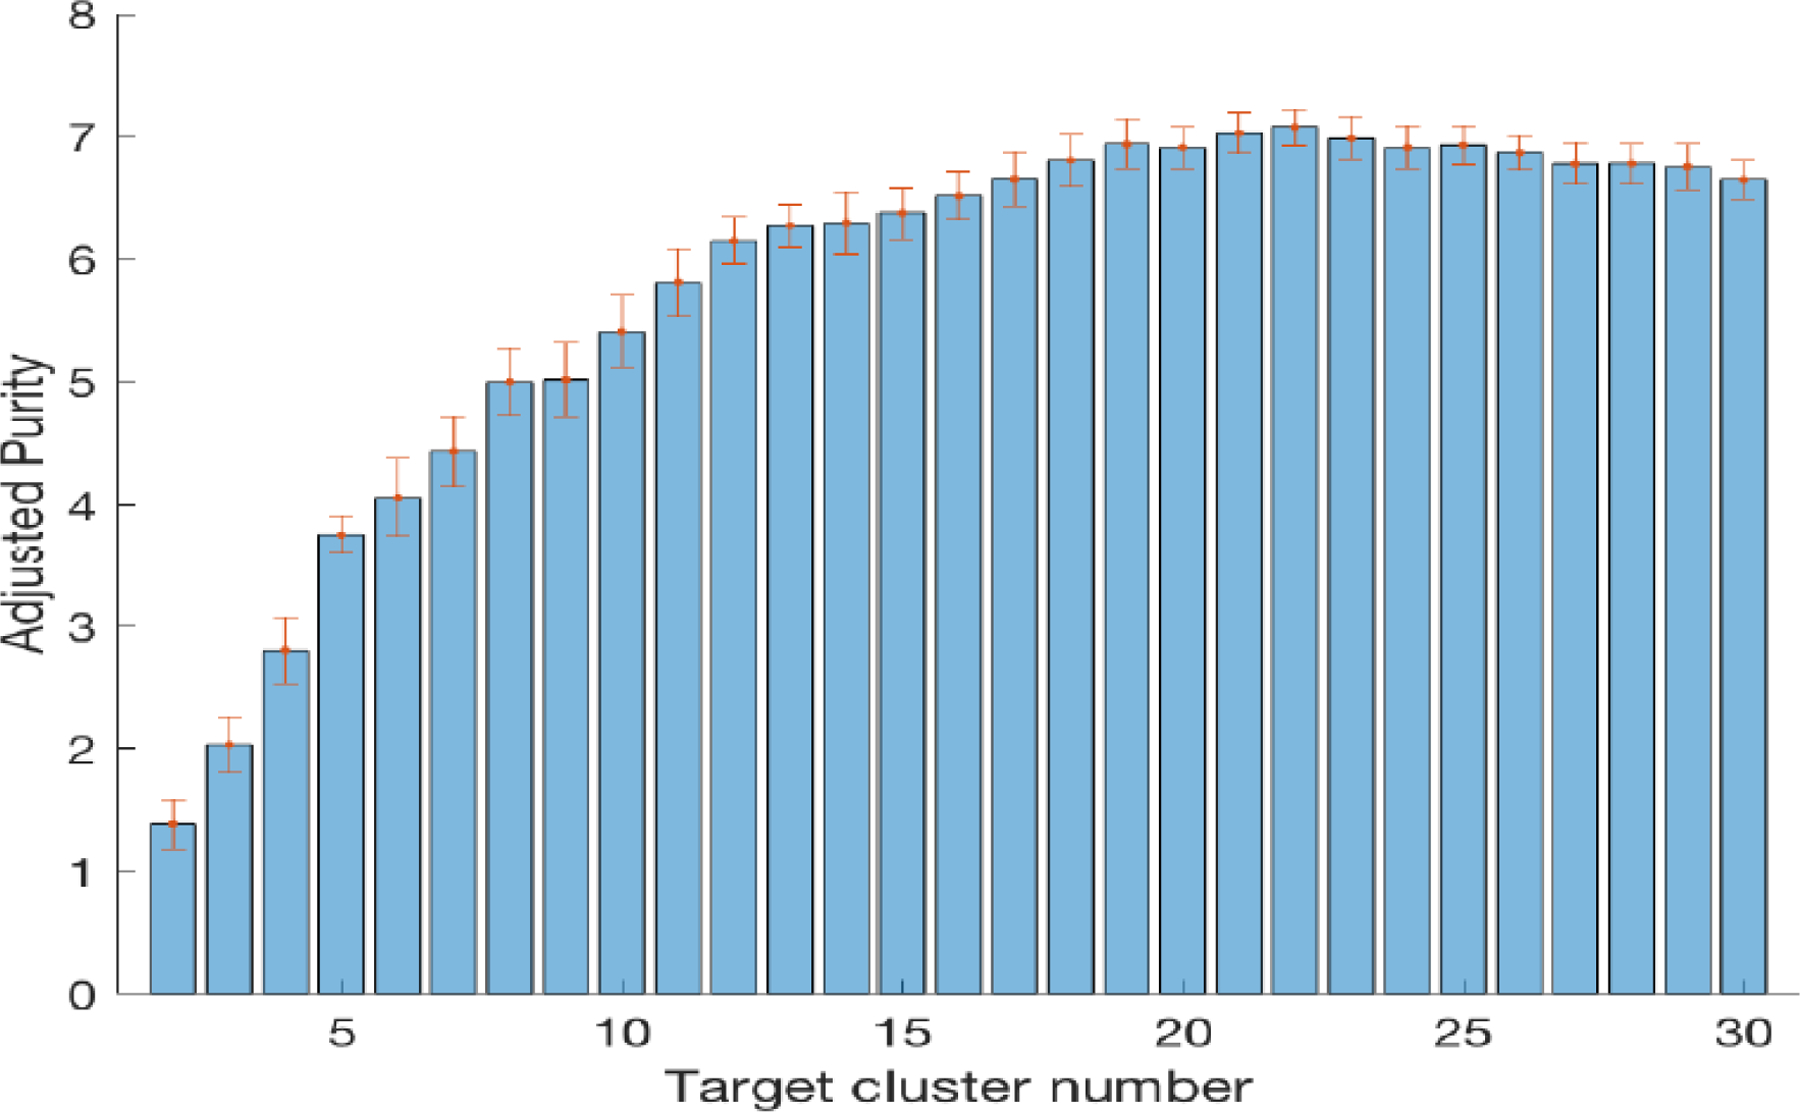
Robustness of clustering analysis for additive noise when the target number of clusters is varied between 2 and 30 when 30 patients were randomly selected from each of the 22 cancer types. The adjusted Purity values were averaged over 100 runs for each target number of clusters. The error bars represent one standard deviation.