
Fig. 4.
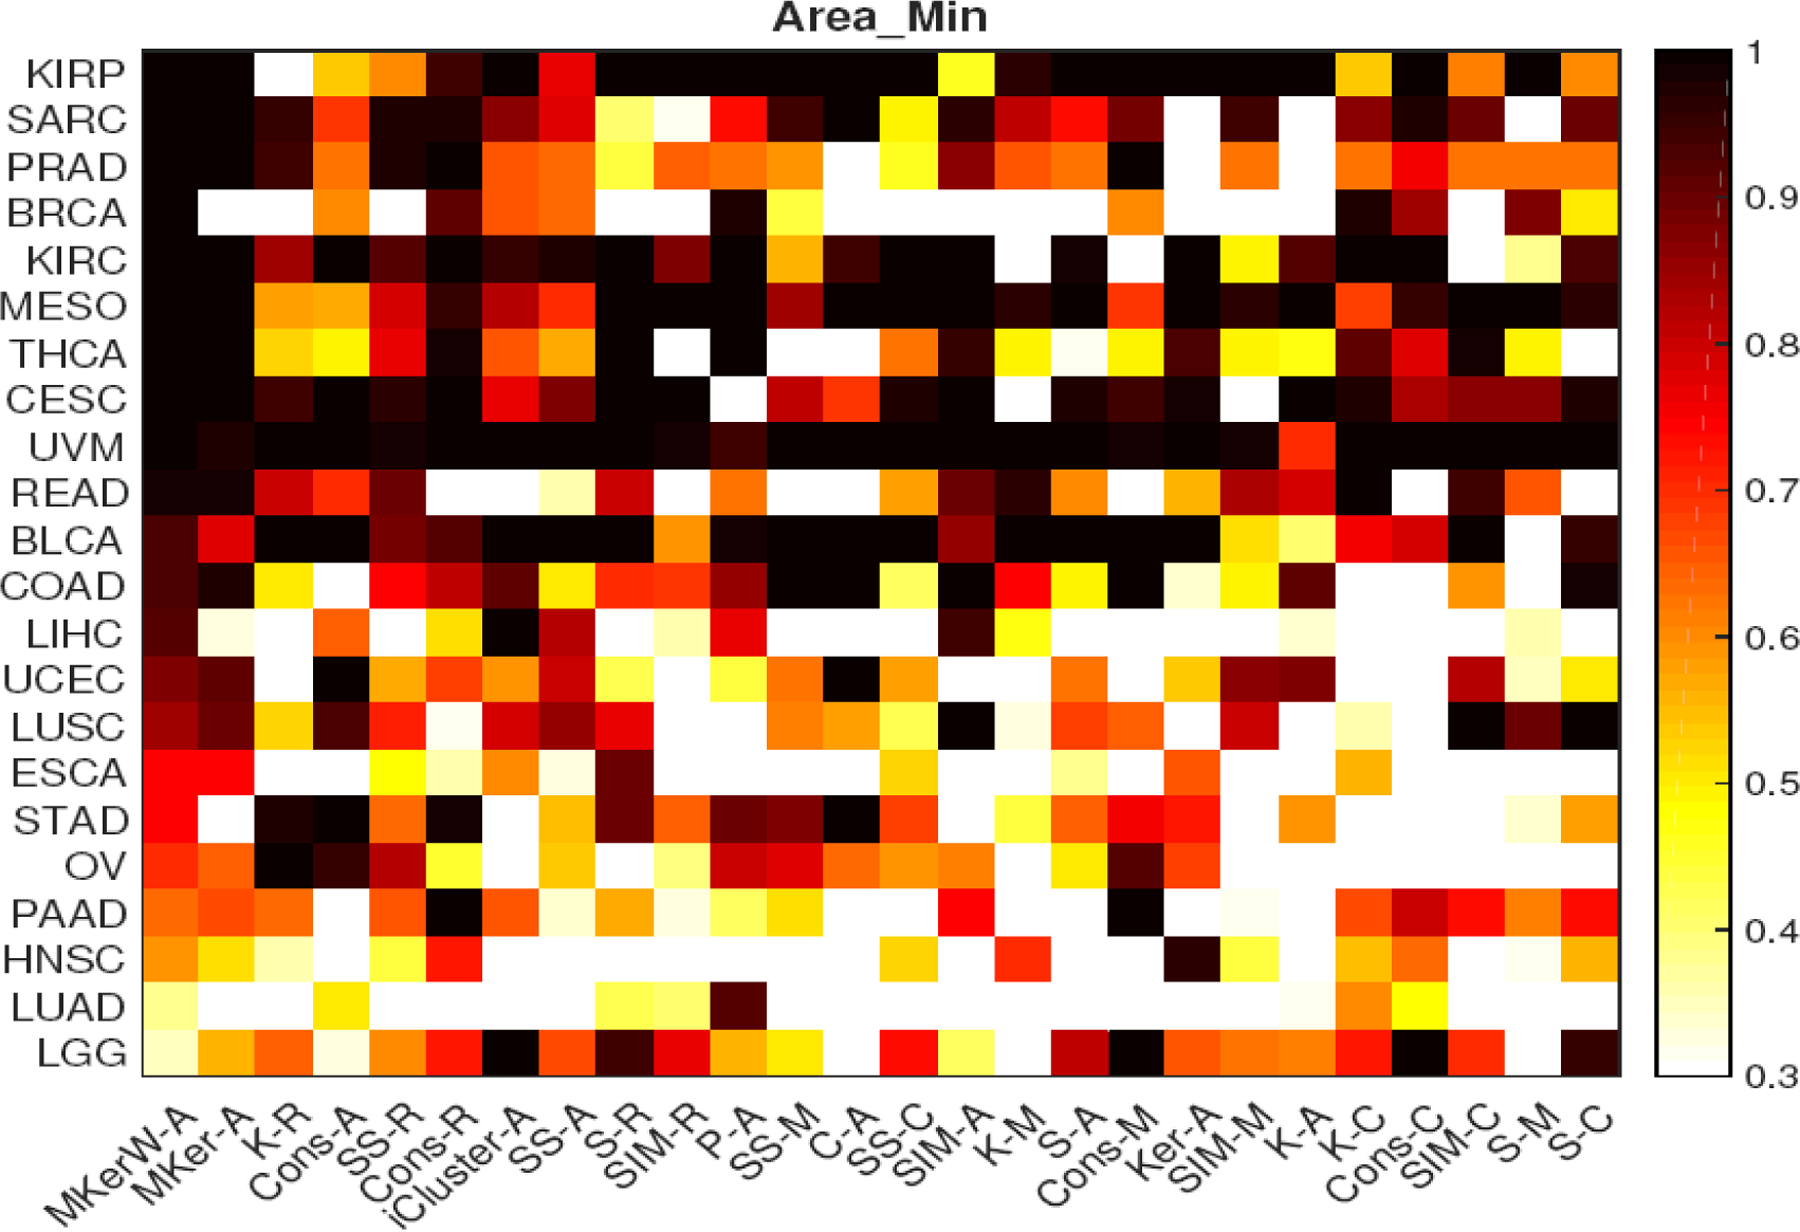
Heatmap of the minimum survival curves area proportion. Abbreviations of the cancer types and clustering methods are given on the left and bottom. Legend for the shades is given on the right. For details of abbreviations of the 22 cancer types, see Section G of the Supplementary materials.