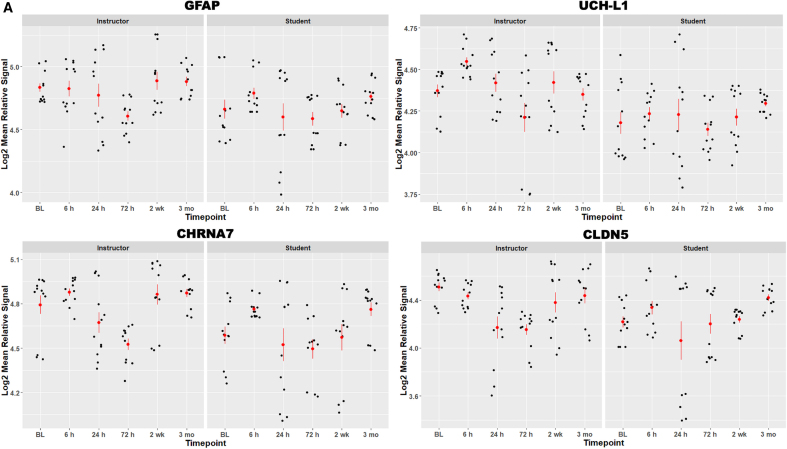
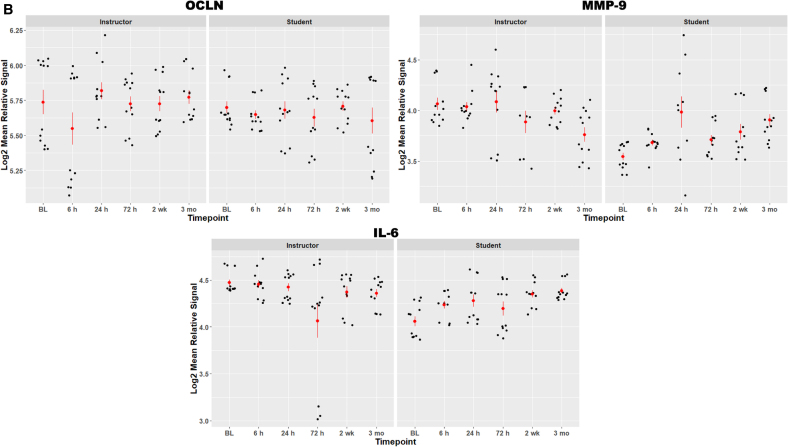
FIG. 2.
(A,B) Scatter plot visualization of protein biomarker data for all persons across time points. Red bars are standard error of the mean. Serum biomarker values are expressed as log2 mean relative signal per biomarker. BL, baseline; GFAP, glial fibrillary acidic protein; UCH-L1, ubiquitin carboxy-terminal hydrolase L1; CHRNA7, cholinergic receptor nicotinic alpha 7 subunit; CLDN5, claudin-5; OCLN, occludin; MMP9, matrix metallopeptidase 9; IL-6, interleukin 6.


