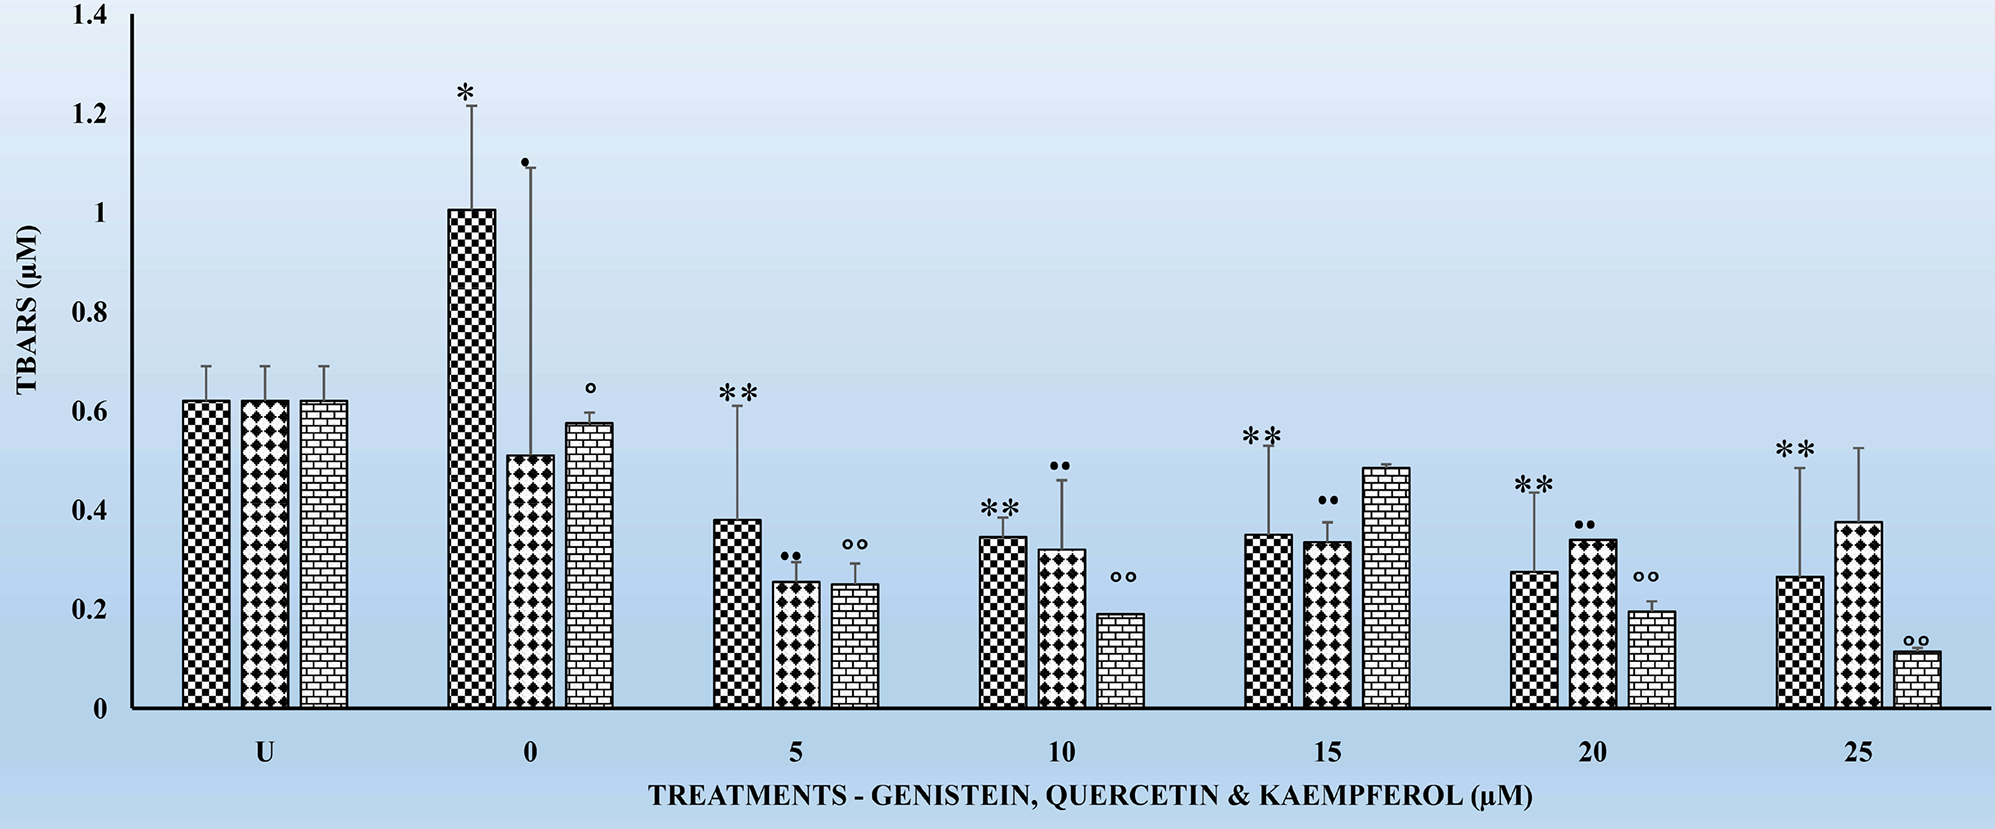
Figure 1.

The effects several doses (0, 5, 10, 15, 20, and 25 μM) each of genistein (G), quercetin (Q) and kaempferol (K) on thiobarbituric reactive substances (TBARS) in pooled human liver microsomes (HLMs), following incubation at 37°C and 5% CO2 for 4 h. Each bar chart for each flavonoid ± standard deviation in this and other figures (i.e., Figures 2–4) in this article represent mean the for 3 different experiments for each dose level of G, Q and K tested and, which was assayed in triplicates. Statistical significances denoted by asterisk in Figures 2–4 are shown as comparison between the respective control (i.e., without G, Q and K) and G, Q and K HLMs treated subgroups. Vertical bars in this and other figures denote standard deviation. The X-axis labels for Figures 2–4 are defined as follows: U means untreated cells samples; 0 means control cell samples not treated with G, Q and K; 5, 10, 15, 20, and 25 μM means cell samples were each treated with the respective dose of G, Q and K for 4, 6, 18 and 24 h.
