Figure 4.

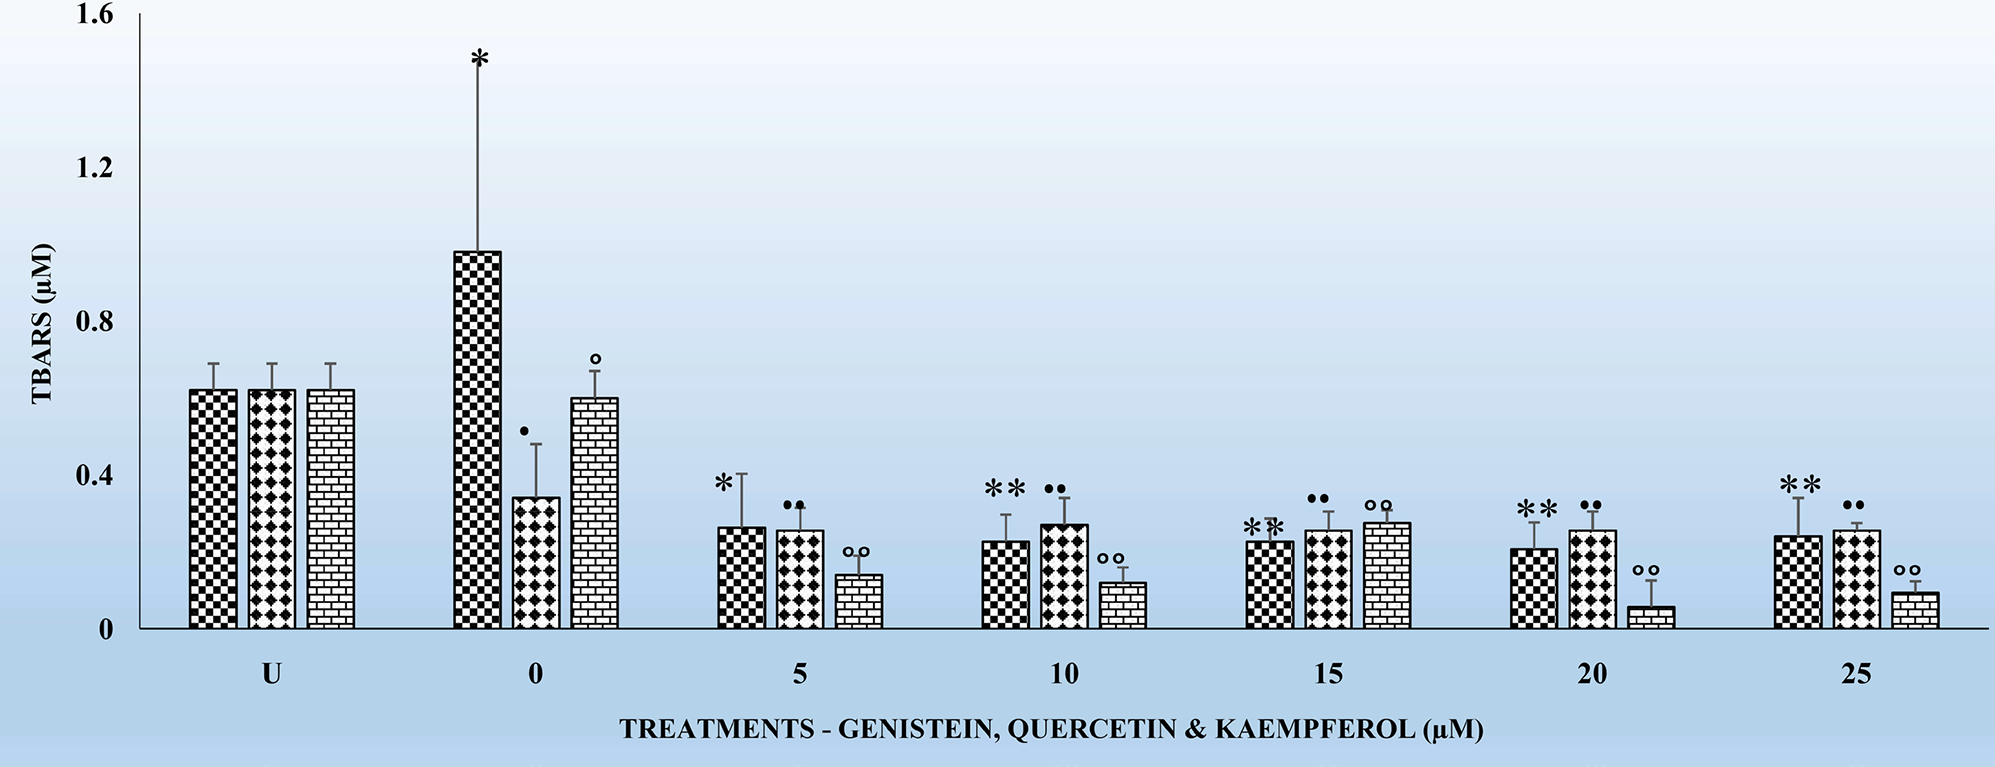
The effects of several doses (0, 5, 10, 15, 20, and 25 μM) each of G, Q and K on TBARS in HLMs, following incubation at 37°C and 5% CO2 for 24 h. For comparison and statistical differences see Figure 1.

The effects of several doses (0, 5, 10, 15, 20, and 25 μM) each of G, Q and K on TBARS in HLMs, following incubation at 37°C and 5% CO2 for 24 h. For comparison and statistical differences see Figure 1.