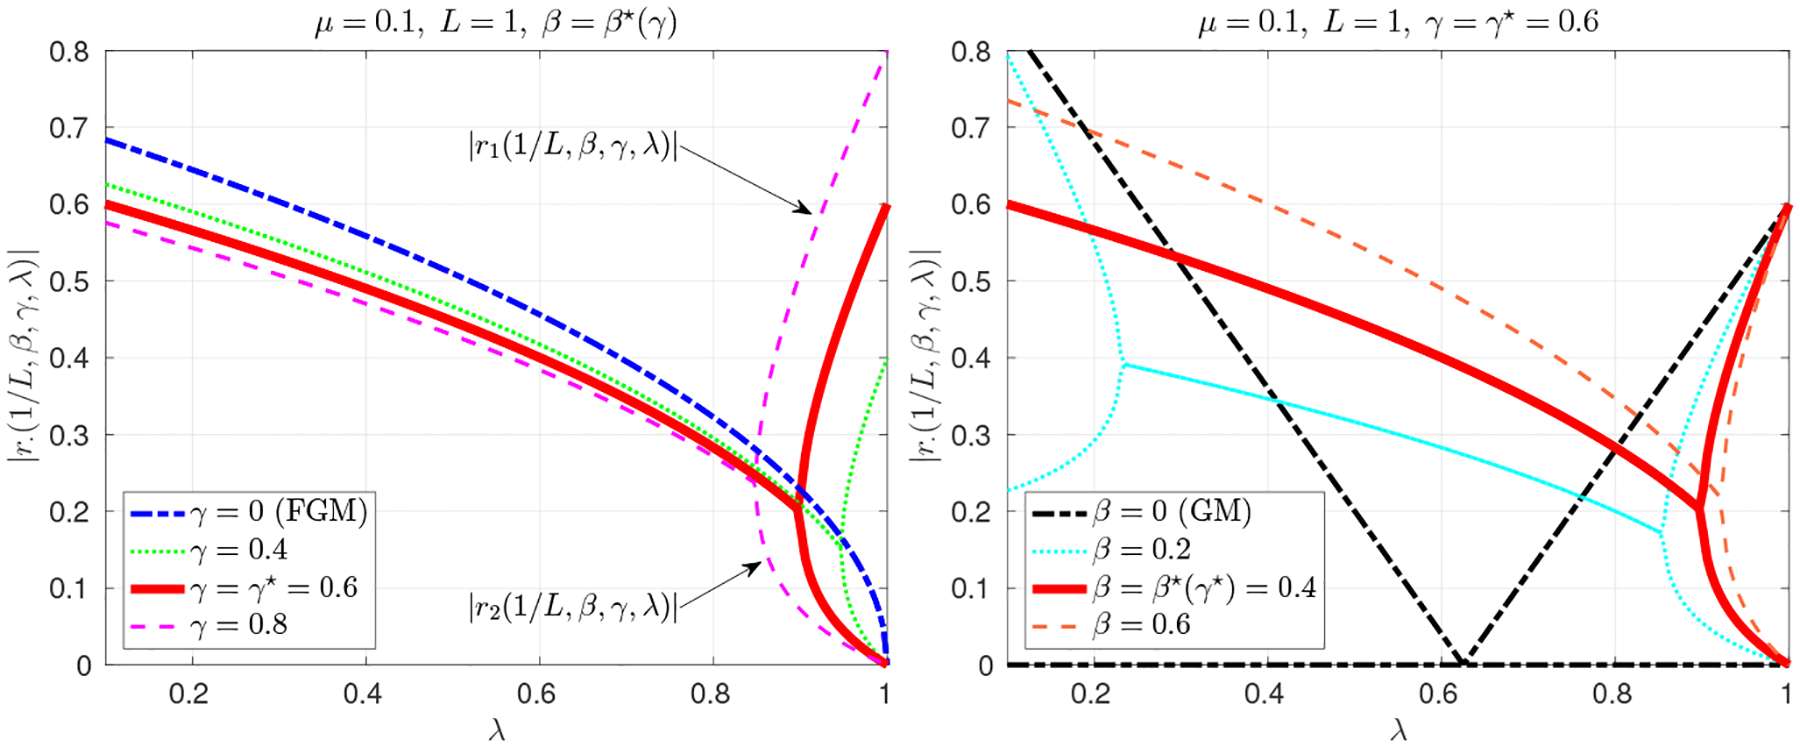
Fig. 1.

Plots of |r1(1/L, β, γ, λ)| and |r2(1/L, β, γ, λ)| over μ ≤ λ ≤ L for various (Left) γ values for given β = β⋆(γ), and (Right) β values for given γ = γ⋆, for a strongly convex quadratic problem with q = 0.1, where (β⋆, γ⋆) = (0.4, 0.6). Note that the maximum of |r1(1/L, β, γ, λ)| and |r2(1/L, β, γ, λ)|, i.e. the upper curve in the plot, corresponds to the value of ρ(Tλ(1/L, β, γ)) in (16).
