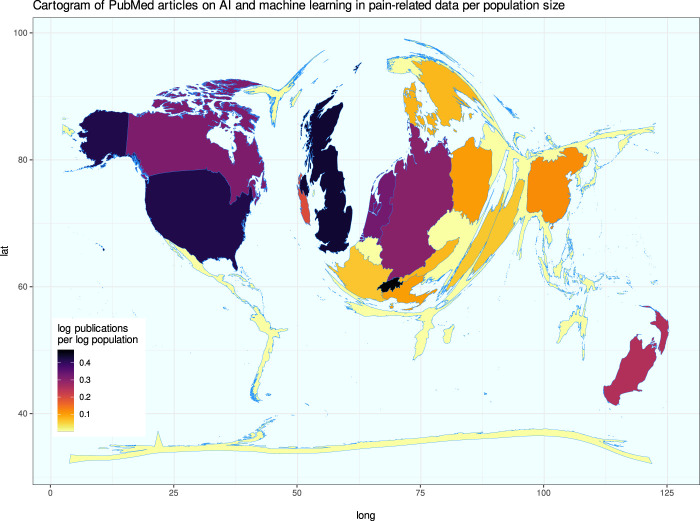
Figure 6.
Bibliometric exploration of PubMed listed publications on the topic of AI and machine learning in pain research. Results of a computed PubMed database analysis of year and country of origin of publications not listed as reviews. Cartogram of the publication activity per county standardized at the average population of the respective country during the analyzed period, plotted as spatial plots with Gaussian blur as described in 24. Boundaries of regions are transformed to be proportional to publication counts. The figure has been created using the software package R (version 4.2.0 for Linux; https://CRAN.R-project.org/)73 and the libraries “ggplot2” (https://cran.r-project.org/package=ggplot2)93 and “Rcartogram” (https://github.com/omegahat/Rcartogram).45

