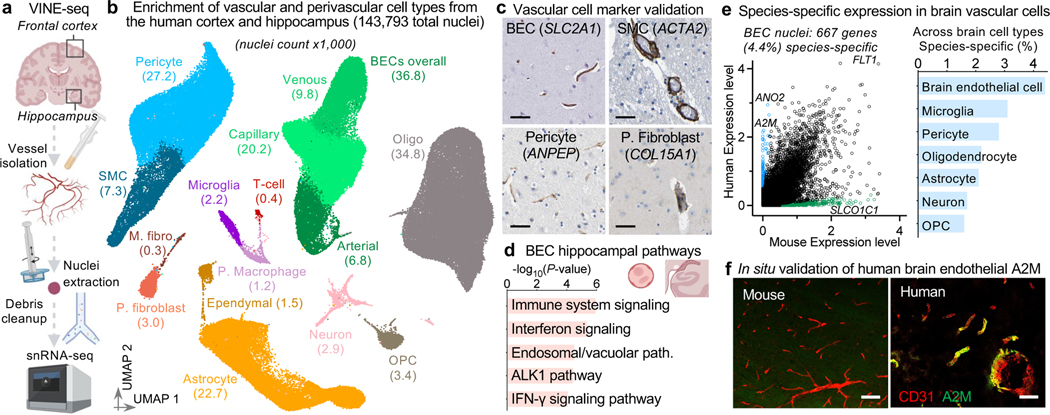
Figure 1. Cells of the human brain vasculature.
a, VINE-seq method to enrich vascular nuclei from postmortem human brain samples.
b, Uniform Manifold Approximation and Projection (UMAP) of 143,793 nuclei from 25 human hippocampus and superior frontal cortex samples across 17 individuals, colored by cell type and labeled with nuclei numbers.
c, Immunohistochemical validation of cell type-specific gene markers. Scale bar = 50 microns. Image credit: Human Protein Atlas (http://www.proteinatlas.org)25.
d, Enriched biological pathways in BECs from the hippocampus compared to the superior frontal cortex, in not cognitive impairment (NCI) individuals (P value < 0.05, cumulative hypergeometric test).
e, Scatter plot (left) depicting mRNA expression levels (logCPM) of mouse and human genes with one-to-one orthologs in BECs. Divergently expressed genes are colored (>10-fold difference, minimum 0.5 log2CPM expression). Proportion of each brain cell type’s transcriptome that is specific to human versus mouse (same thresholds, right).
f, Immunohistochemical validation of A2M protein specifically in the human but not mouse vasculature. Scale bar = 50 microns.

