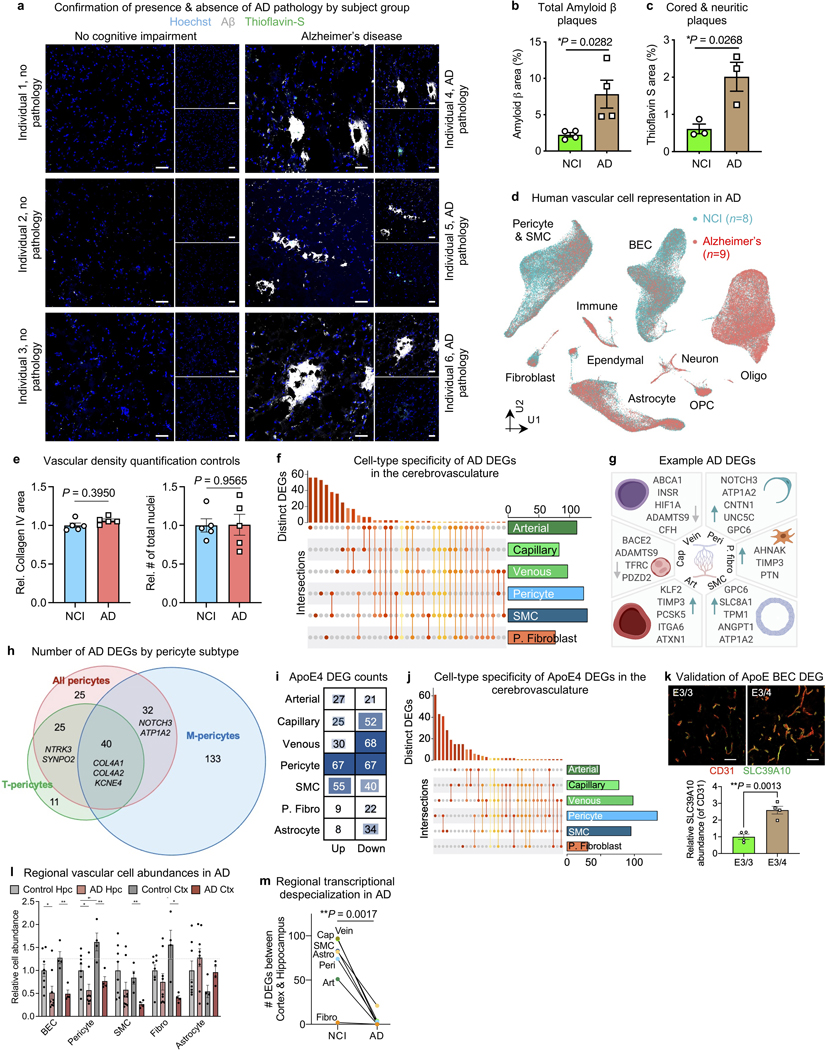
Extended Data Fig. 8. Vascular cell-type specific perturbations in AD patients and ApoE4 carriers.
a, Immunohistochemistry with anti-β-amyloid antibody (D54D2, white), Thioflavin S (green), and Hoechst (blue) in the hippocampus of NCI and AD individuals. Scale bar = 40 microns.
b, Quantification of β-amyloid immunostaining in (a) for overall β-amyloid (n=4 NCI and AD, two-sided t-test; mean +/− s.e.m.).
c, As in (b) but for cored and neuritic β-amyloid plaques (n=3 NCI and AD, two-sided t-test; mean +/− s.e.m.).
d, UMAP of 143,793 nuclei captured from 17 human hippocampus and superior frontal cortex samples, colored by Alzheimer’s disease (AD) diagnosis.
e, Quantification controls for Fig. 5b. Quantification of Collagen IV+ vasculature (left) and number of total (regardless of Collagen IV+ overlap) Hoechst+ nuclei (n = 5 NCI and AD, nested two-sided t-test; mean +/− s.e.m.).
f, Matrix layout for intersections of AD DEGs shared across and specific to each cell type. Circles in the matrix indicate sets that are part of the intersection, showing that most DEGs are cell type-specific.
g, Example differentially expressed genes (DEGs) in AD: arterial (Art), capillary (Cap), venous (Vein), pericyte (Peri), perivascular fibro blast-like cell (P. fibro), and smooth muscle cell (SMC). Blue arrow indicates upregulated and grey arrow downregulated genes.
h, Summary of the number of AD DEGs by pericyte class: T-, M-, and all pericytes combined to evaluate DEGs that could arise due to a disproportionate loss of M-pericytes in AD.
i, Differentially expressed gene (DEG) counts for each cell type in ApoE4 carriers (n = 5 ApoE3/3, n = 11 ApoE3/4 or ApoE4/4): arterial (Art), capillary (Cap), venous (Vein), pericyte (Peri), perivascular fibro blast-like cell (P. fibro), and smooth muscle cell (SMC). The intensity of the blue color and the size of the squares are proportional to entry values.
j, Matrix layout for intersections of ApoE4 DEGs shared across and specific to each cell type. Circles in the matrix indicate sets that are part of the intersection, showing that most DEGs are cell type-specific.
k, Immunohistochemical validation of the predicted upregulated anti-inflammatory DEG SLC39A10 in venous BECs of ApoE4 carriers. Scale bar = 50 microns (n = 4 ApoE3/3 and ApoE4 carriers, nested two-sided t-test; mean +/− s.e.m.).
l, Among patients with both hippocampus and superior frontal cortex profiled (n=4 NCI and n=4 AD), quantification of the relative abundance of major vascular cell types (NCI hippocampus set as reference, unpaired two-sided t-test; mean +/− s.e.m.). *BEC P = 0.0260, **BEC P = 0.0023, *Pericyte P (left) = 0.0357, *Pericyte P (mid) = 0.0237, **Pericyte P = 0.0077, **SMC P = 0.0075, *Fibroblast P = 0.0109, *Astrocyte P = 0.0357
m, As in (l), but comparison of the number of DEGs between brain regions for each cerebrovascular cell type. Analysis done separately for NCI and AD samples (n=7 cell types, unpaired two-sided t-test; mean +/− s.e.m.).

