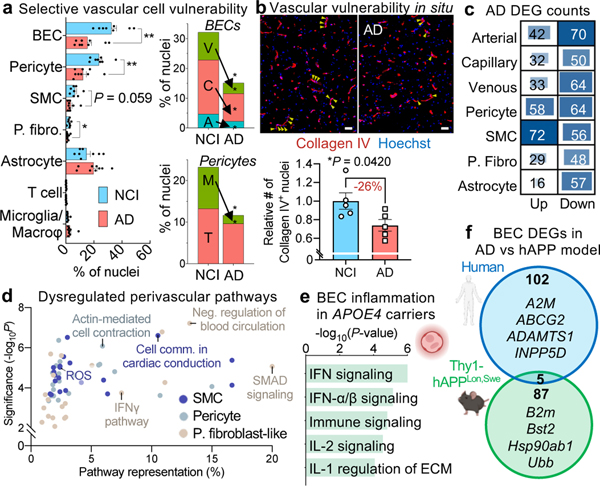
Figure 5. Vascular cell-type specific perturbations in Alzheimer’s disease.
a, Proportion of cell types captured in Alzheimer’s disease (AD) and no cognitive impairment individuals (NCI) (left). Proportion of BEC and pericyte subpopulations in AD and NCI (right) (n = 8 NCI, n = 9 AD, two-sided t-test; mean +/− s.e.m.). **BEC P = 0.002, **Pericyte P = 0.003, *P. fibroblast P = 0.0461.
b, Immunohistochemical validation of a loss of vascular cell density in AD (number of Hoechst+ nuclei within Collagen IV+ vasculature). Scale bar = 50 microns (n = 5 NCI and AD, nested two-sided t-test; mean +/− s.e.m.). Yellow arrows denote example vascular nuclei.
c, Differentially expressed gene (DEG) counts for each cell type in AD. The intensity of the blue color and the size of the squares are proportional to entry values.
d, Enriched biological pathways from AD differentially expressed genes in pericytes, smooth muscle cells, and perivascular fibroblast-like cells, plotted by Pathway Representation (in a given pathway, what proportion of all members are DEGs) and Significance (-log10P) of pathway enrichment.
e, Enriched biological pathways from genes upregulated in AD APOE4 carriers in capillary and venous endothelial cells (P value < 0.05, cumulative hypergeometric test).
f, Venn diagram comparing DEG BECs in human AD samples compared to those from the Thy1-hAPP T41BLon,Swe amyloidosis mouse model37. Note that only genes with human-mouse orthologs are shown, and that the absolute logFC threshold for calling DEGs in mouse APP BECs was lowered to 0.15 (by half) to ensure claims of limited overlap with human BECs were robust.

