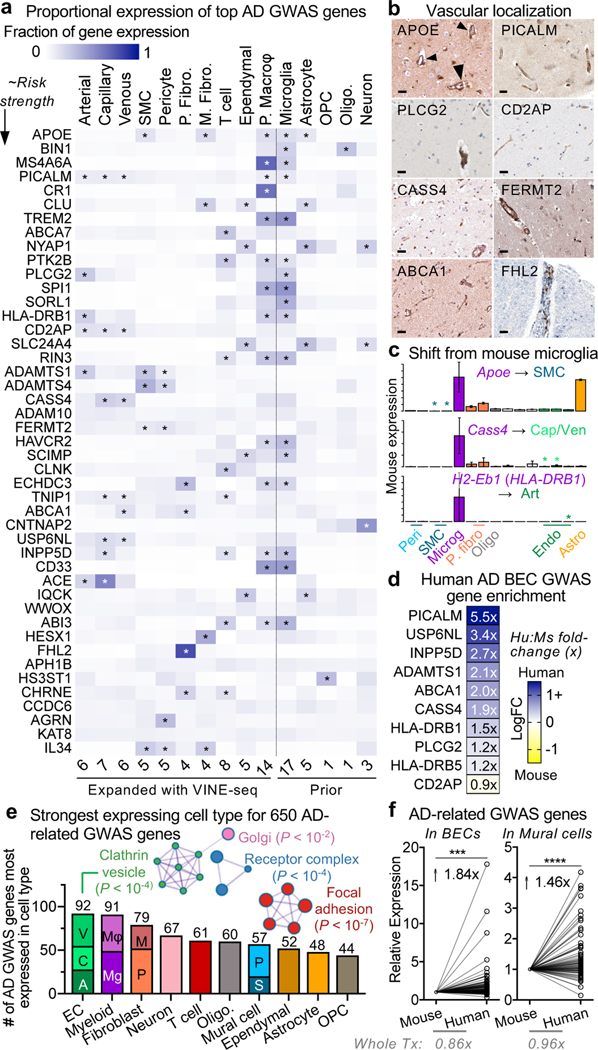
Figure 6. GWAS disease variants are enriched in the human brain vasculature.
a, Proportional expression of the top 45 AD GWAS genes across all major brain cell types. Expression values for a given gene sums to 1 across cell types using the EWCE method42. Genes ordered in approximate risk strength39–41,51. Asterisks denote strongest expressing cell types. Cells to the left of dashed line are from the vasculature, newly added here; to the right, parenchymal cells captured before. Numbers on the bottom summarize the number of GWAS genes enriched in a given cell type.
Note: MSA46A represents the average expression of MS4A46A, MS4A4A, and MS4A4E; likewise, HLADRB1 averages HLA-DRB1 and HLA-DRB5. EPHA1 was not robustly detected.
b, Immunohistochemical confirmation of vascular localization of proteins encoded by top AD GWAS genes from (a). Scale bar = 25 microns. Arrowheads in APOE point to signal around larger diameter vessels, consistent with SMC expression. Image credit: Human Protein Atlas (http://www.proteinatlas.org)25.
c, Examples of genes expressed specifically in mouse microglia but then also expressed in human brain vascular cell types (n of ∼3,500 whole cell mouse transcriptomes12, mean value +/− SEM).
d, BEC heatmap of top AD GWAS genes colored by logFC(human/mouse) and labeled by the linear foldchange (human/mouse) value.
e, Quantification of the number of AD and AD-related trait GWAS genes17 most expressed in a given cell type. 383 of 651 genes (59%) mapped to vascular or perivascular cell types. PPI network of GO Cellular Components (P value < 0.05, cumulative hypergeometric test).
A = arterial, C = capillary, V = venous endothelial cell (EC). Mg = microglia, and Mφ = macrophage. In fibroblasts, M = meningeal and P = perivascular. In mural cells, S = SMC and P = pericyte.
f, Human enrichment of AD-related trait GWAS genes17 highest expressed in BECs (left) and mural cells (right). In contrast to GWAS genes, the ratio of human to mouse expression across the overall transcriptome is less than or ∼1 for both cell types (bottom, paired two-sided t-test, ****P < 0.0001 and ***P = 0.0002).

