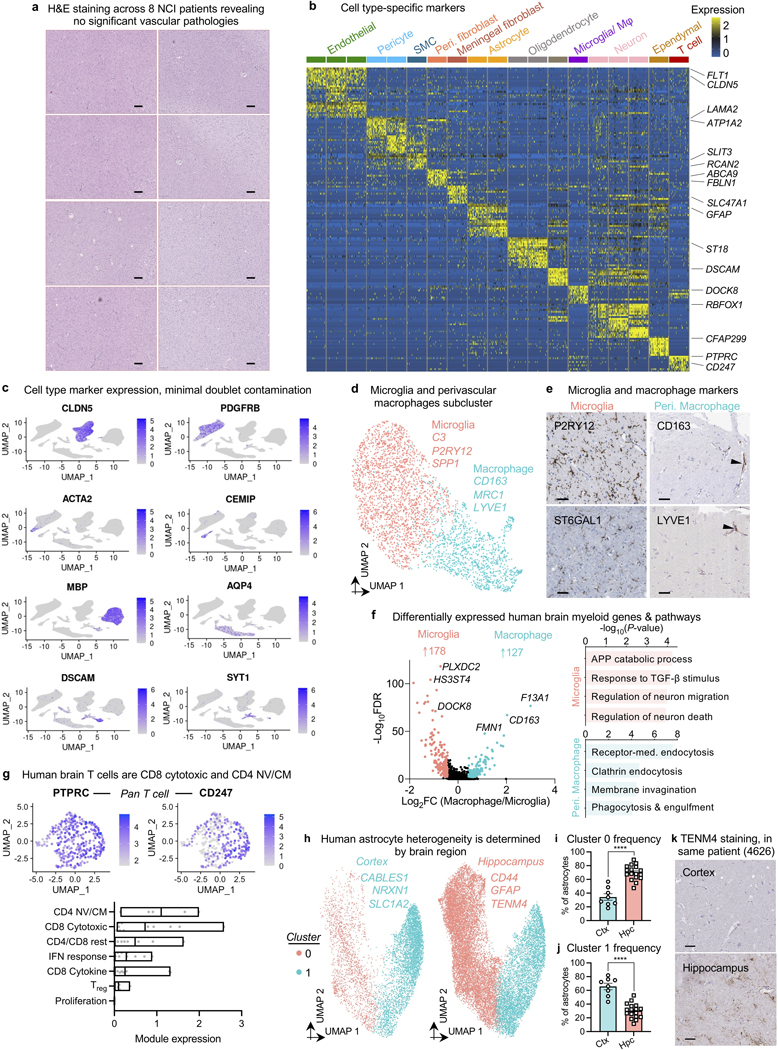
Extended Data Fig. 2. Diversity and heterogeneity of human brain vascular cell types.

a, Representative H&E images used by two neuropathologists to evaluate NCI cortical and hippocampal tissue for vascular pathology. No significant vascular pathology was observed. Scale bar = 200 μM.
b, Discovery of the top cell type-specific marker genes across the major classes of cells captured. The color bar indicates gene expression from low (blue) to high (yellow).
c, Validation of cell type annotations and confirmation of minimal doublet contamination using established cell type markers.
d, UMAP projection of captured myeloid cells, forming two distinct clusters corresponding to parenchymal microglia and brain barrier macrophages. Example marker genes listed.
e, Immunohistochemical validation of microglial and perivascular macrophage markers. Scale bar = 50 microns. Image credit: Human Protein Atlas (http://www.proteinatlas.org)25,75.
f, Global view of differentially expressed genes comparing human brain macrophages and microglia (left, MAST, Benjamini Hochberg correction; FDR < 0.01 and logFC>0.5 [log2FC>0.72] to be colored significant). Pathways enriched in microglia versus macrophages (right), recapitulating interesting biology such as the unique TGF-β molecular signature in microglia76.
g, Expression of top gene markers for various T cell subtypes (top), and quantification of their expression as a module (bottom)77. Brain T cells exhibit highest expression of markers corresponding to CD8 cytotoxic and CD4 Naive/Central memory (NV/CM) T cells.
h, UMAP projection of captured astrocytes, forming two distinct clusters, and split by brain region. Example marker genes listed.
i-j, Quantification of astrocyte cluster 0 (b) and 1 (c) frequency in the cortex and hippocampus (n=8 cortex and n=17 hippocampus, Mann-Whitney t-test; mean +/− s.e.m.).
k, Immunohistochemical validation of the brain region-specific astrocyte marker TENM4. Scale bar = 50 microns.
