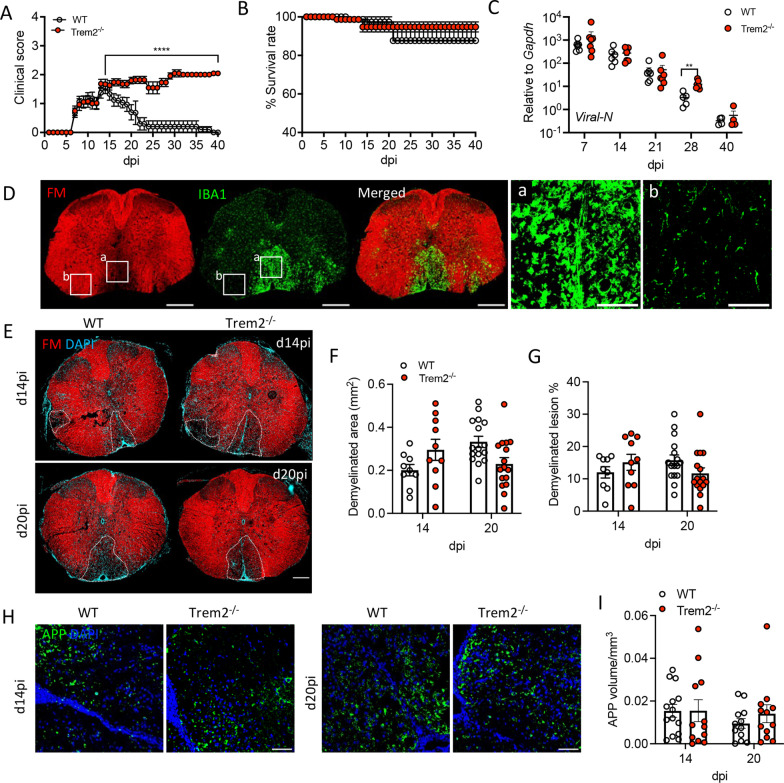
Fig. 2.
Failed recovery of diseased Trem2−/−-infected mice is not associated with worsened demyelination or axonal damage. Disease progression (A) and mortality (B) of MHV–JHM-infected WT (n = 24) and Trem2−/− (n = 30) mice. p values of clinical scores were determined by Mann–Whitney unpaired t test. C Time course of virus replication monitored by Viral-N mRNA levels using RT-PCR. Data are the mean ± SEM from 2 independent experiments (n = 3–4 mice/timepoint/experiment) and are analyzed by unpaired two-tailed Student t test and two-way ANOVA analysis followed by Bonferroni test. **p < 0.001, ****p < 0.00001. D Representative images of a demyelinated lesion in a coronal WT mouse SC section detected by loss of FM staining (red) and accumulation of active IBA1 positive microglia/BMDM (green) at day 20 pi. Scale bar = 200 μm. Zoomed-in images show a demyelinated (a) and non-lesioned area (b). Scale bar = 50 μm. E Representative images showing staining of thoracic SC sections of MHV–JHM-infected WT and Trem2−/− mice with FM (red) and DAPI (cyan) at days 14 and 20 pi. White-dotted lines outline the demyelinated area. Scale bar = 100 μm. F Lesion size per mm2 and G proportion of SC white matter demyelination. H Representative images of axonal damage by staining with anti-APP Ab (APP:red, DAPI:blue); I Volume of APP positive area per μm3 in the lesions. Scale bar = 50 μm. Data show the mean ± SEM from 12 to 18 lesions from 3 mice (4–6 lesions/mouse) per timepoint and are analyzed by unpaired two-tailed Student t test and two-way ANOVA analysis followed by Bonferroni test. Individual lesions are represented by a circle

